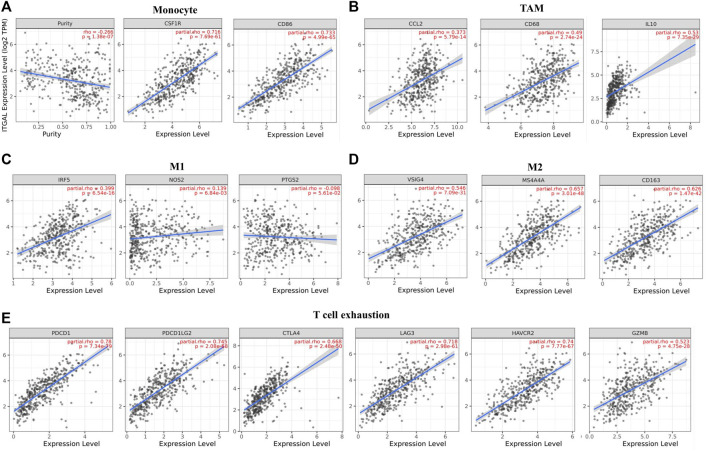
FIGURE 5.
ITGAL expression correlated with monocyte, macrophages, and T cell exhaustion in stomach adenocarcinoma (STAD). Markers include CD86 and CSF1R of monocytes; CCL2, CD68, and IL10 of TAMs; NOS2, IRF5, and PTGS2 of M1 macrophages; and CD163, VSIG4, and MS4A4A of M2 macrophages. Scatterplots of correlations between ITGAL expression and gene markers of monocytes (A), TAMs (B), and M1 (C), M2 macrophages (D) and T-cell exhaustion (E) in STAD (n = 415).

