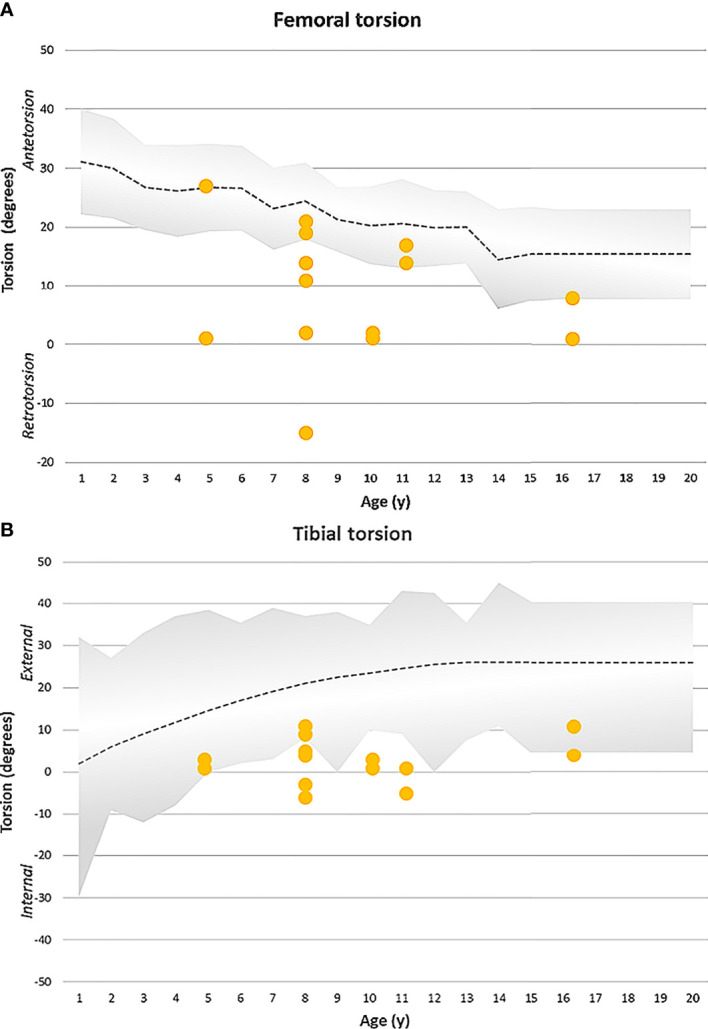
Figure 4.

(A) Femoral torsion (MRI measurement) observed in the XLH cohort (yellow dots represent each femur) with Burosumab therapy compared to the norm group (grey). 8/14 femora showed reduced antetorsion, respectively retrotorsion. Radiographic norm group values (+-1SD) were obtained from Fabry et al. (17). (B) Tibial torsion (MRI) was assessed in a XLH population undergoing Burosumab therapy (yellow dots represent each tibia). 9/14 legs showed reduced external tibial torsion. Clinical reference values (+-2SD) obtained by Staheli et al. (18) are shown by the grey area.
