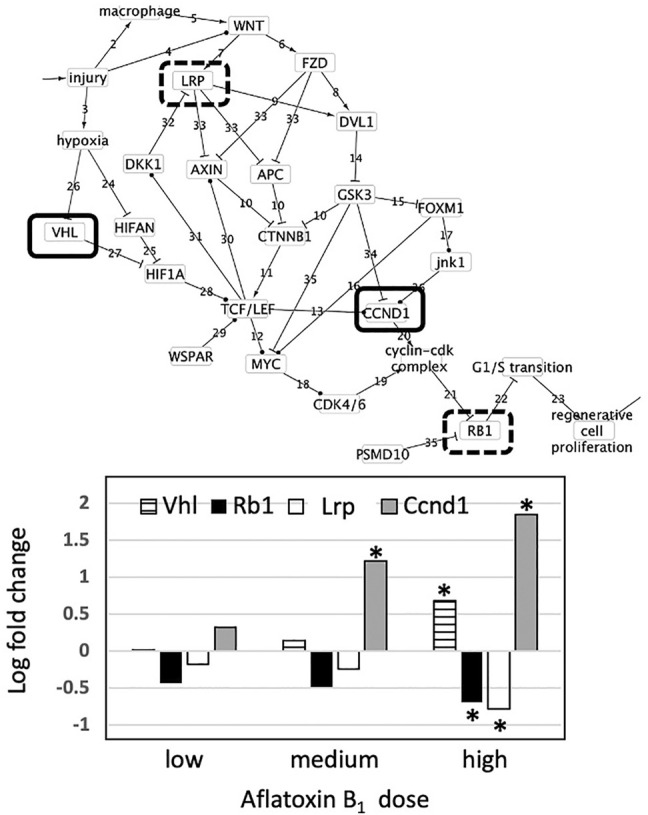
FIGURE 3.

Effect of aflatoxin B1 on expression of genes found in the causal subnetwork for regenerative proliferation in rat liver. We analyzed gene expression data from livers of rats exposed to a single low (1 mg/kg), medium (3 mg/kg) or high (10 mg/kg) dose of aflatoxin B1 that were sacrificed after 24 h of exposure. Expression of the gene Vhl is denoted by a hatched column, Rb1 by a black column, and Ccnd1 by a grey column in the chart. Gene expression values significantly different from controls are denoted with asterisks in the chart. Upregulated genes are denoted by a solid lined box in the subnetwork diagram and downregulated genes by dashed box.
