Fig. 2.

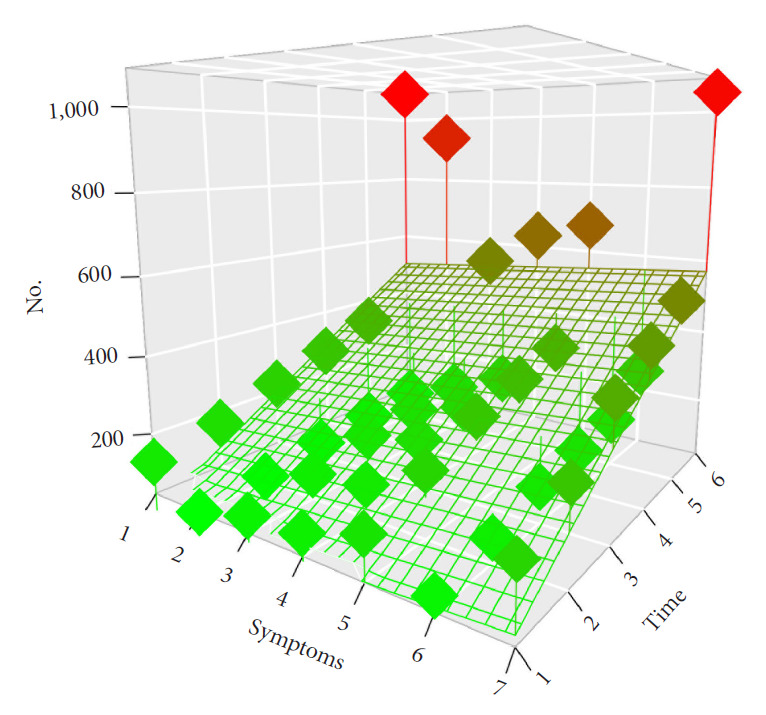
Three-dimensional scatter plot of the symptoms distribution over the time after spinal meningioma surgery with the display of the associated regression plane indicating a highly significant decreased of all symptoms over the time (p<0.001).

Three-dimensional scatter plot of the symptoms distribution over the time after spinal meningioma surgery with the display of the associated regression plane indicating a highly significant decreased of all symptoms over the time (p<0.001).