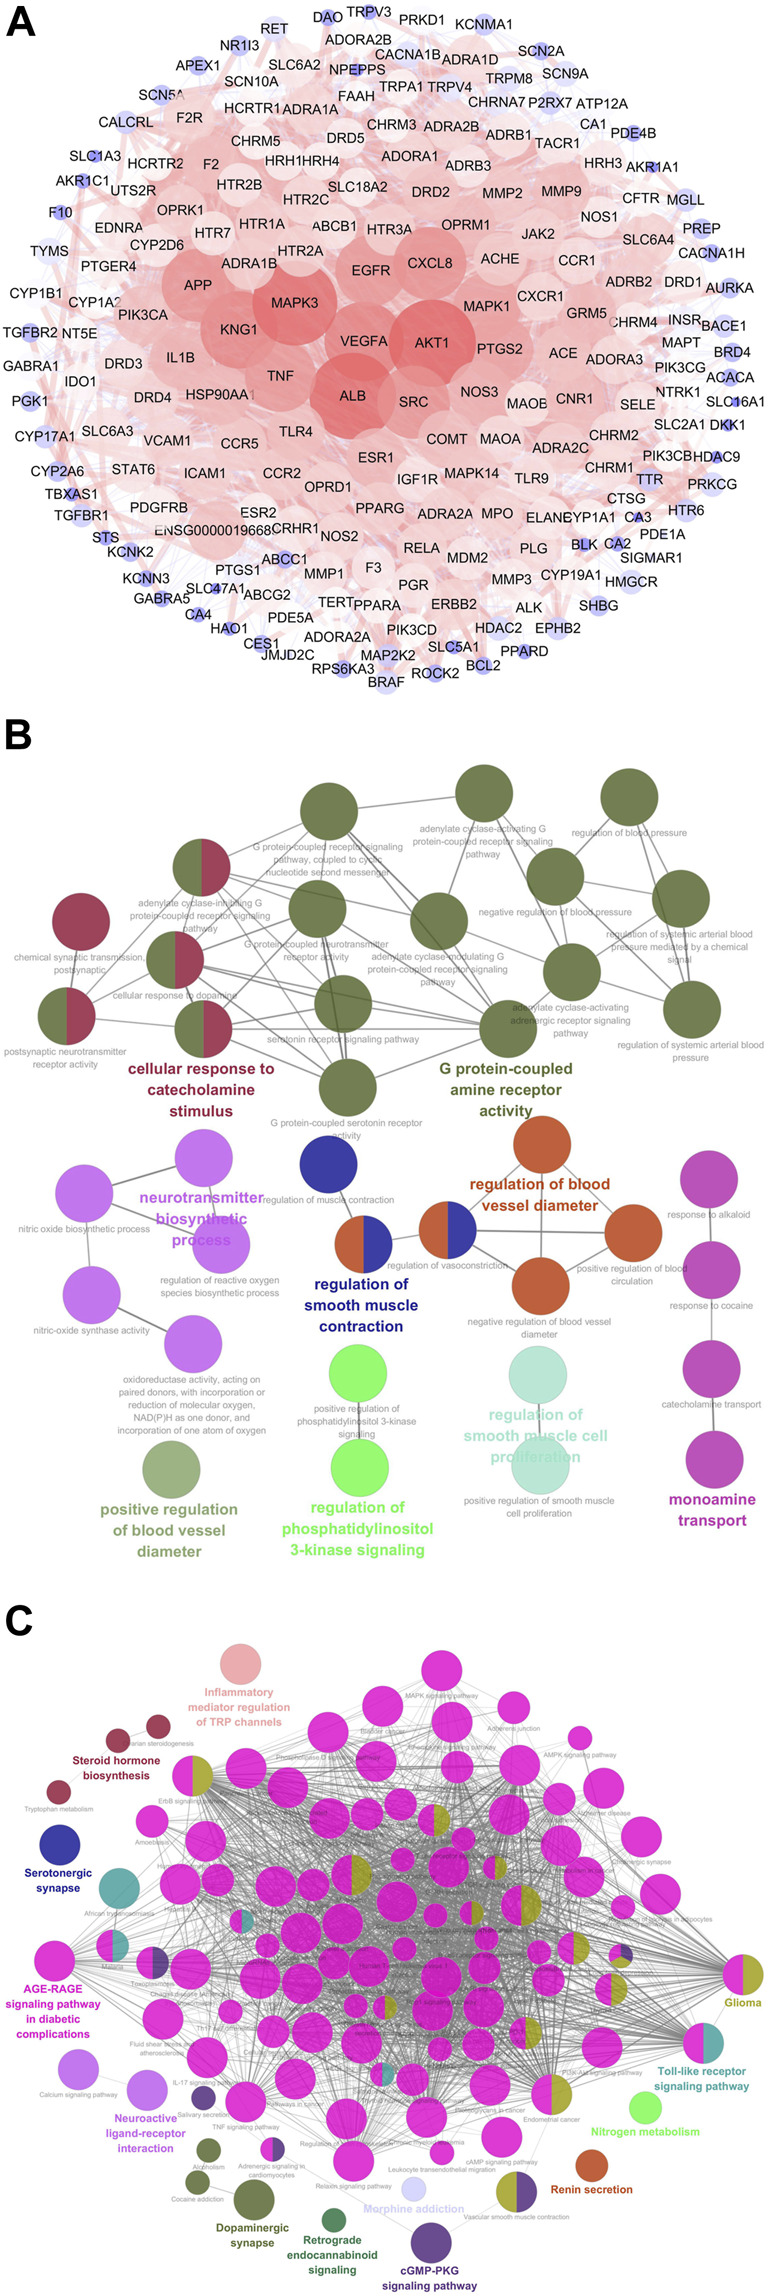
FIGURE 6.

Network pharmacology analysis of CRCR in migraine treatment. (A) The protein–protein interaction network of 201 potential targets responsible for CRCR against migraine. The nodes represent targets, while the edges represent the association between nodes and nodes, and the node size represents degree value. (B) The Gene Ontology (GO) biological process analysis of potential targets by ClueGo. (C) The Kyoto Encyclopedia of Genes and Genomes (KEGG) enrichment analysis of potential targets by ClueGo.
