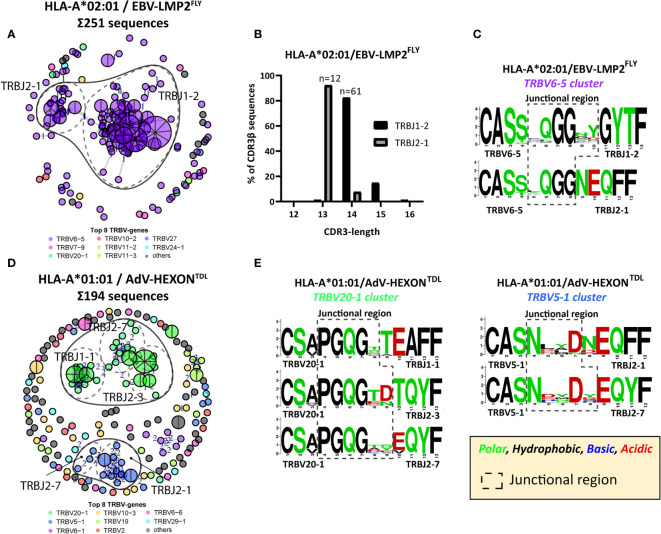
Figure 5.
Computation analysis reveals clustering of PUB-HS CDR3β AA-sequences that contained conserved regions in the CDR3β-region. Computational analysis was performed using the levenshtein distance (differences in AAs) between CDR3β AA-sequences of one specificity. CDR3β AA-sequences were plotted and colored according to the top 8 most frequent TRBV-genes and were clustered and linked by a line if they were similar, with a number (levenshtein distance of 1, 2 or 3) representing the differences in AAs. PUB-I CDR3β AA-sequences were plotted as a pie-chart, whereby the size and number of slices indicate in how many individuals this CDR3β AA-sequence was present. Sequence logos generated using WebLogo (http://weblogo.berkeley.edu/logo.cgi) show the relative frequency of each AA at each given position. The junctional region (AAs that do not align with the germline TRBV or TRBJ-gene) are shown within the box with the dotted-line (A) Shown is a representative example of a virus-specific CD8pos T-cell population, specific for EBV-LMP2FLY with overlapping clusters of sequences that express different TRBJ-genes, while expressing the same TRBV-gene. (B) The lengths of the CDR3β-regions of the two clusters of EBV-LMP2FLY-specific CDR3β-sequences are shown. Varying lengths of the CDR3β-region within a cluster would suggest deletions or insertions, whereby the same length would indicate AA substitutions. (C) Shown are the sequence motifs of the two EBV-LMP2FLY-specific clusters. (D) Shown is a second representative example of a virus-specific CD8pos T-cell population, specific for AdV-HEXONTDL, with overlapping clusters of sequences that express different TRBJ-genes, while expressing the same TRBV-gene. (E) Shown are the sequence motifs of the TRBV20-1 and TRBV5-1-expressing EBV-HEXONTDL-specific clusters.

