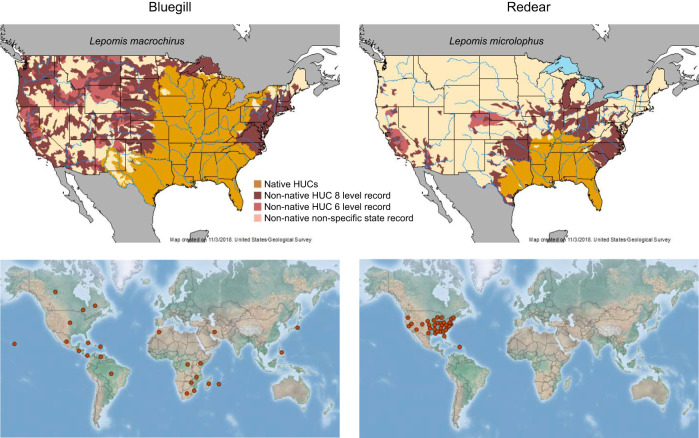
Fig. 1.
Distributions of the bluegill sunfish and redear sunfish reveal an expanded native range and distribution for bluegill. In the top panels, the native ranges are shown in tan and expanded ranges in the USA are shown in shades of red indicating various levels of evidence. The data is from the United States Geological Survey (USGS) Nonindigenous Aquatic Species Database (https://nas.er.usgs.gov/). In the bottom panels, the current global distributions are shown with data taken from the CABI (Centre for Agriculture and Bioscience International) Invasive Species Compendium (https://www.cabi.org/ISC/). The left panels correspond to the bluegill sunfish and the right panels correspond to the redear sunfish.

