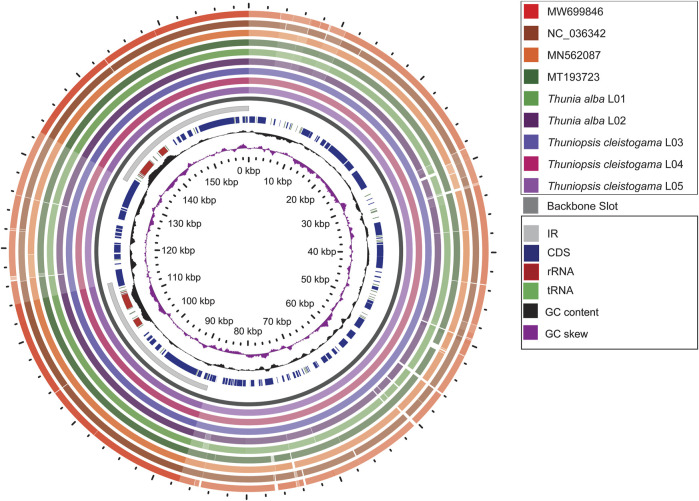
FIGURE 4.
Graphical map shows nine circular plastome assemblies using Thuniopsis cleistogama_L04 plastome alignment as a reference. The innermost ring shows the genome size in kbp, followed by GC skew (purple) and GC content (black). The remaining rings denote BLAST comparisons of plastome sequences. From the inner to outer: Thuniopsis cleistogama_L05, Thuniopsis cleistogama_L04, Thuniopsis cleistogama_L03, Thunia alba_L02, Thunia alba_L01, MT193723; MN562087; NC_036342 and MW699846. The similar and divergent locations are represented by continuous and interrupted track lines, respectively. The lightly screened area stretching from the inner toward the outer circle marks divergent regions with large sequence differences.

