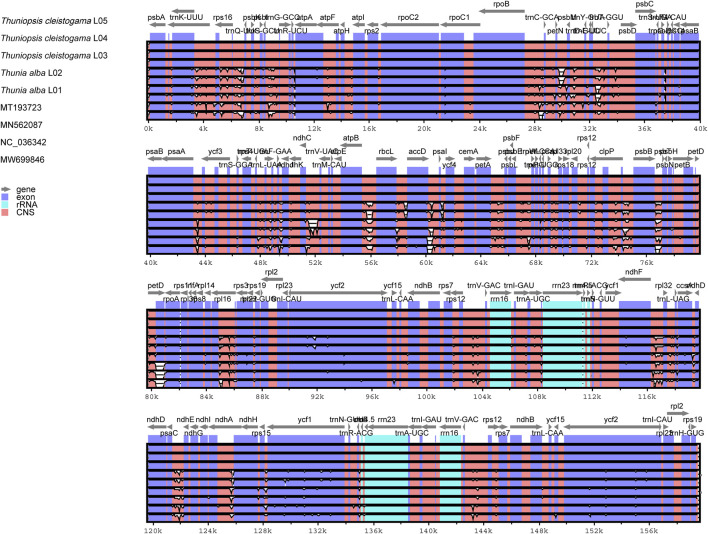
FIGURE 7.
Comparison of nine cp genomes of six taxa using mVISTA program with Thuniopsis cleistogama_L04 cp genome as a reference. The top gray arrows above the alignment indicate genes and their orientation. A cut-off of 70% was used for the plots. Genome regions are color coded. Blue and red areas indicate protein-coding regions and the conserved non-coding sequences (CNS) regions, respectively.

