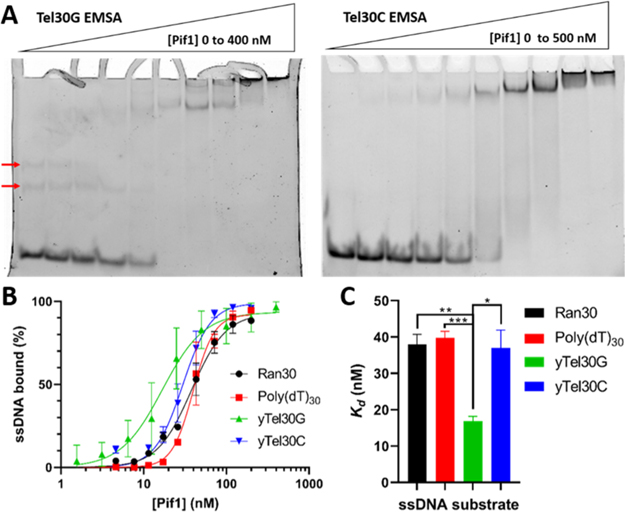
Figure 1.
Effects of DNA sequence on Pif1 binding affinity. (A) EMSA gel images with the yTel30G or yTel30C oligonucleotide. Red arrows indicate putative secondary structures formed by this substrate that display slower mobility. (B) Compiled binding curves of triplicate EMSAs. (C) Bar graph display of Kd values for all EMSAs performed in triplicate. Statistical significance was determined via multiple t tests using the Holm-Sidak method, with α = 0.05. *p < 0.01, **p < 0.001, and ***p < 0.0001.

