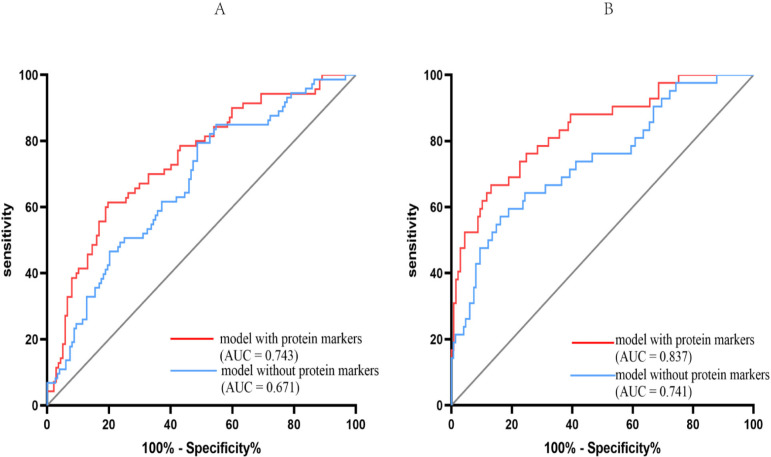
Figure 2.
Receiver operating characteristics (ROC) curve analysis for models distinguishing clinical states. ROC curves were generated representing models that differentiated between amnestic mild cognitive impairment (aMCI) (A) or Alzheimer’s disease (AD) (B) from controls. in each case, the area under the curve (AUC) for selected models was calculated and is shown. The red line represents the model including protein markers as covariates. The blue line represents the model without protein markers as covariates.

