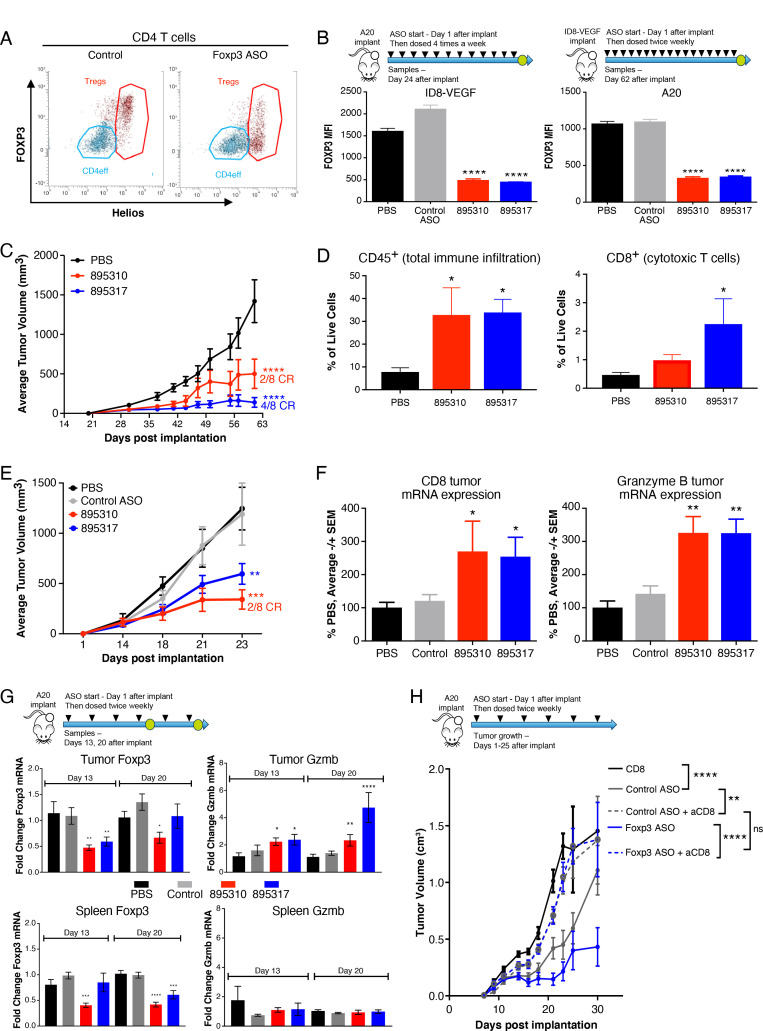
Figure 4.
Single-agent antitumor efficacy mediated by mouse FOXP3 ASOs. (A–F) ID8-VEGF or A20 tumor-bearing mice were systemically treated with FOXP3 ASOs starting at day 1 after implant at 50 mg/kg BIW until day 62 (ID8-VEGF) or four times per week until day 24 (A20). N=8 per group. (A) Tumors were dissociated and tumor-infiltrating Tregs were analyzed by flow cytometry. Helios +CD4 Tregs are shown in red. (B) FOXP3 protein expression was measured in Helios +CD4 Tregs. Line graphs show (C) ID8-VEGF and (E) A20 tumor volumes. The number of complete responses (CR) vs total number of animals in the group is indicated next to lines. (D) ID8-VEGF tumors were dissociated, and abundance of total tumor-infiltrating leukocytes (CD45 +cells) and CTL (CD8 +T cells) were analyzed by flow cytometry. (F) Total RNA from A20 tumors was analyzed for the mRNA expression of CTL marker CD8 and immune cell activation marker GzmB. (G) A20 tumor-bearing mice were treated with indicated ASO or vehicle control 50 mg/kg BIW and tumors analyzed by flow cytometry at day 13 or day 20 time points. N=10 per group. Bar charts show tumor or spleen Foxp3 and GzmB expression measured by RT-qPCR. (H) CD8+ T cells were depleted in vivo with an αCD8 blocking antibody in A20 tumor-bearing mice that were treated with indicated ASO or control at 50 mg/kg BIW. N=12 per group. Data represent >4 independent experiments in (A–F), two independent experiments in (G) and a single cell depletion experiments in (H). *, P≤0.05; **, p≤0.01; ***, p≤0.001; ****, p≤0.000 by one-way analysis of variance (ANOVA) with Dunnett’s post-test for (B, D, F and G) and two-way ANOVA with Dunnett’s post-test for (C, E and H). Differences are calculated relative to PBS (B–G) or as indicated on the panel (H). ASOs, antisense oligonucleotides; BIW, two times per week; mRNA, messenger RNA; PBS, phosphate buffered saline; VEGF, vascular endothelial growth factor.

