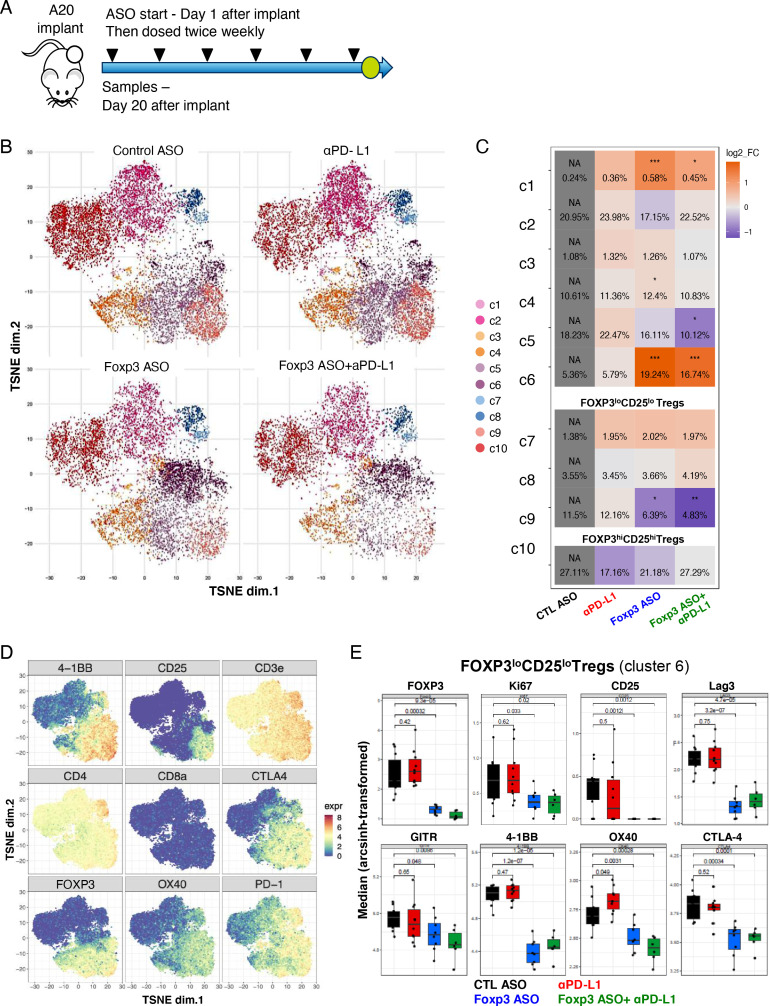
Figure 6.
FOXP3 ASOs reprogram Treg effector cell phenotype in vivo in combination with αPD-L1 immune checkpoint blockade. (A) Mice were treated with ASO (50 mg/kg BIW) and αPD-L1 (10 mg/kg BIW) alone or in combination from day 1 post A20 tumor-implantation. N=14 per group. Tumors were analyzed by mass cytometry at day 20 after implantation. (B) t-SNE analysis of tumor-infiltrating CD4+ T cells. (C) Relative changes of CD4 +T cell clusters compared with control group. (D) Expression map of T cells and Tregs markers. (E) Quantification of Treg activation expression markers. Error bars are SD *, p≤0.05; **, p≤0.01; ***, p≤0.001; ****, p≤0.0001 by one-way analysis of variance with Dunnett’s post-test relative to control ASO. ASOs, antisense oligonucleotides; BIW, two times per week; t-SNE, t-distributed stochastic neighbor embedding; PD-L1, programmed cell death ligand 1; Treg, Regulatory T cells.

