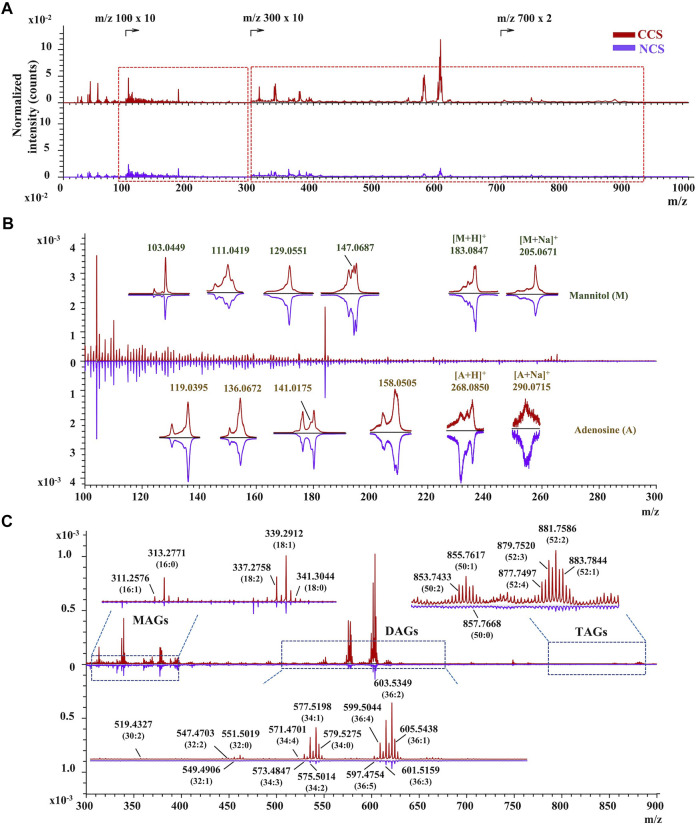
FIGURE 3.
The TOF-SIMS spectra of CCS and NCS samples in positive mode. (A) The typical spectra of CCS (No. 6 in red) and NCS (No. 13 in purple) samples. (B) Identification of mannitol and adenosine with both essential and characteristic fragment ions in the magnified region with m/z value ranging from 100 to 300. (C) Characterization of representative MAGs, DAGs and TAGs in the enlarged region with m/z value from 300 to 900. The TOF-SIMS spectra were normalized by primary ion dose (PID).

