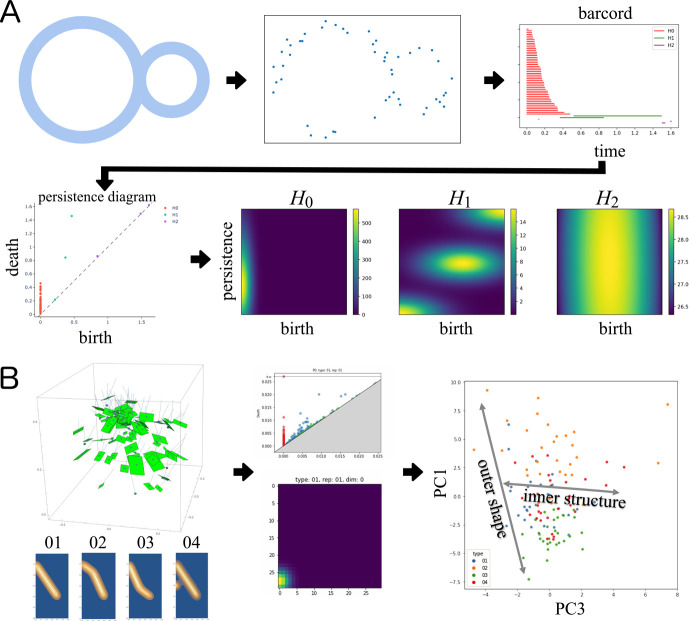
Fig. 3.
Persistent Homology Analysis. A. An example of persistent homology (PH) analysis of point cloud data generated based on a structure. The birth-death profiles of homology classes are summarized in a persistence diagram (PD). Several vectorized representations are derived from the PD for further statistical analysis; persistence images (PIs) are shown here. B. An example of PH analysis of simulated plant foliage. The foliage structures were represented as point cloud data corresponding to leaf positions. Based on the point cloud data, the PD was generated based on the Čech complex. Using PIs, the differences among foliage structures were recognized in the data space generated by principal component analysis.

