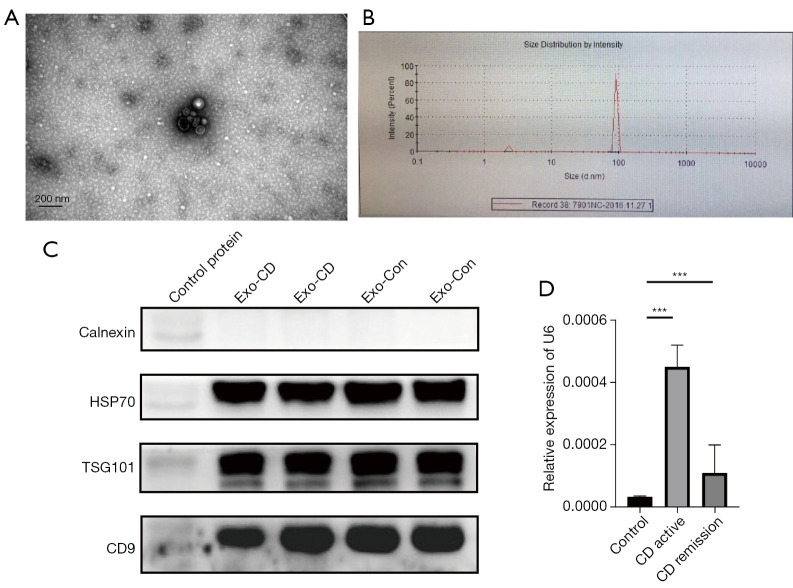
Figure 1.
Characterization of plasma-derived exosomes from patients with CD and healthy controls. (A) Electron micrographs of exosomes purified from plasma. (B) Nanoparticle tracking analysis of plasma-derived exosome size distribution. (C) Western blot of the marker proteins calnexin, HSP70, TSG101, and CD9. Control proteins, normal cell proteins; Exo-CD, plasma-derived exosomes from patients with CD; Exo-Con, exosomes from the plasma of healthy controls. (D) Relative levels of miR-21 in the plasma exosomes of patients with active CD (n=30; female, 15; male, 15), patients in remission with CD (n=30; female, 15; male, 15), and healthy controls (n=30; female, 15; male, 15). ***P<0.001. CD, Crohn’s disease; HSP70, heat shock protein 70; TSG101, tumor susceptibility 101; CD9, cell growth-inhibiting gene 2 protein; miR-21, microRNA 21.

