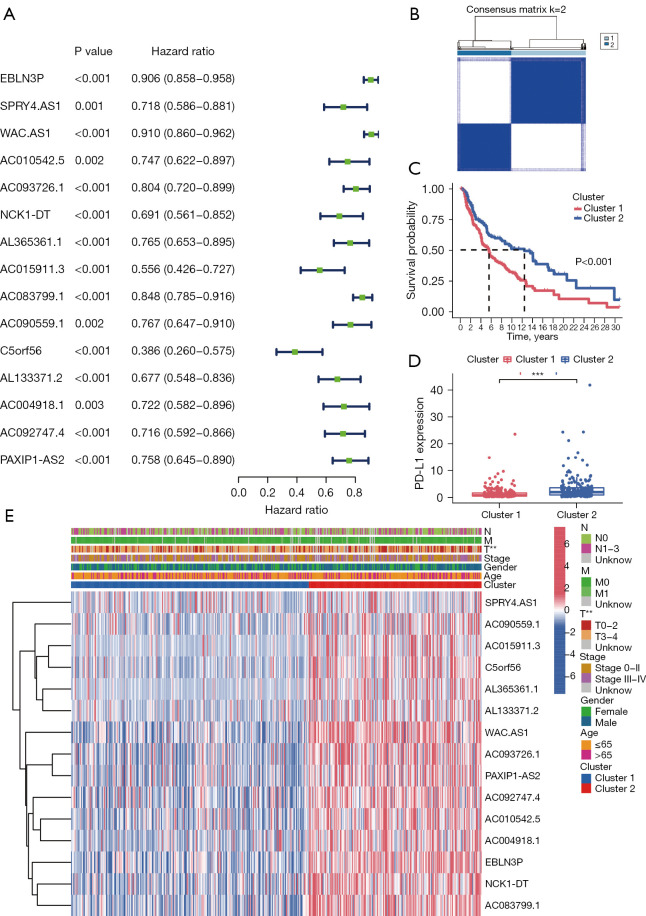
Figure 2.
Consensus clustering of pMRlncRNAs with prognostic value. (A) Forest plot shows the HR with a 95% confidence interval of 15 candidate prognosis-related pMRlncRNAs selected after univariate Cox regression analysis. (B) TCGA cohorts divided into two clusters based on the consensus clustering matrix (k=2). (C) Survival analysis demonstrates a better prognosis of patients from cluster 2. (D) Cluster 2 shows higher PD-L1 expression level than cluster 1. (E) Different distribution of clinicopathological characteristics in the two clusters. **, P<0.01, and ***, P<0.001. pMRlncRNAs, potential-N6-methyladenosine-related long noncoding RNAs; HR, hazard ratio; TCGA, The Cancer Genome Atlas; PD-L1, programmed cell death-Ligand 1.

