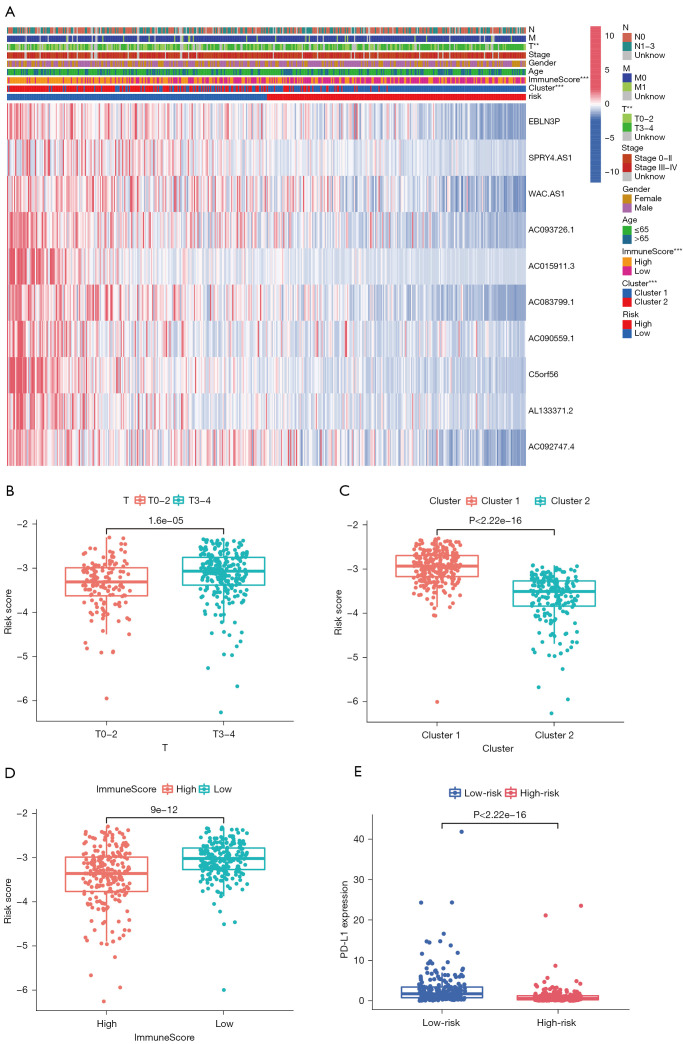
Figure 6.
The risk score correlates with clinicopathological factors in melanoma. (A) Heatmap showing significant differences in T stage, ImmuneScore, and cluster subtype between the 2 risk groups. The risk score in different (B) T stage, (C) cluster subtypes, and (D) ImmuneScore. (E) The low-risk group shows higher PD-L1 expression level than the high-risk group. **, P<0.01, and ***, P<0.001.

