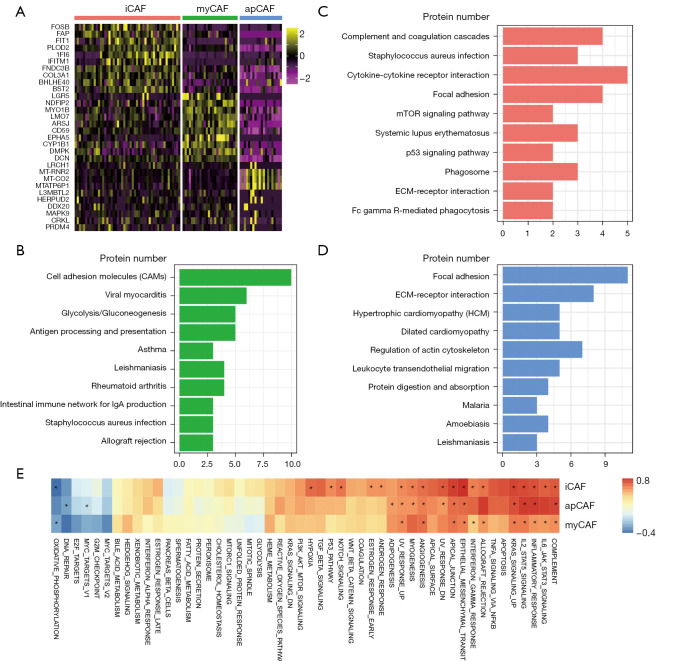
Figure 2.
Molecular characterization of CAFs in PDAC. (A) Heatmap showing the top differently expressed genes in each CAF subtype. (B-D) KEGG pathway annotation of gene signatures of myofibroblastic CAF (B), inflammatory CAF (C) and antigen-presenting CAF (D). (E) Heatmap plotting the Pearson correlation between CAF subtype signature and hallmark signatures in a TCGA-PDAC cohort. R value >0.7 or <−0.3 are marked with asterisk (*). CAFs, cancer-associated fibroblasts; PDAC, pancreatic ductal adenocarcinoma.

