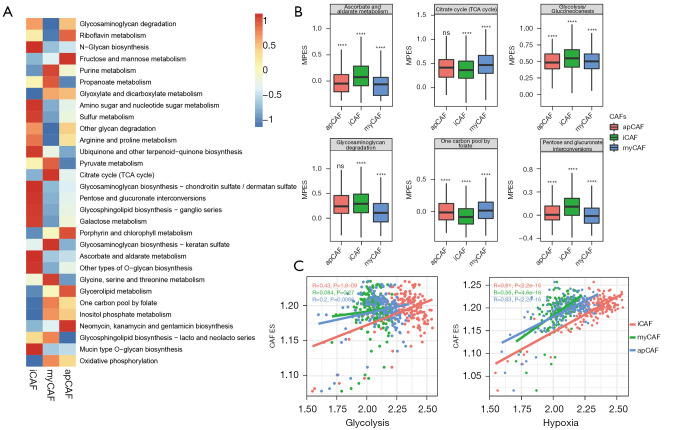
Figure 3.
Metabolic heterogeneity of CAFs. (A) Heatmap showing altered metabolic pathways in CAF subtypes; (B) enrichment score of the top 6 most altered metabolic pathways (****, P<0.0001); (C) Dot plot showing the different correlation between CAF subtypes and metabolic pathways using Pearson correlation algorithm. CAFs, cancer-associated fibroblasts. ns, not significant. ES, enrichment score; MPES, metabolic pathway enrichment score. myCAF, myofibroblastic CAF; iCAF, inflammatory CAF; apCAF, antigen-presenting CAF.

