FIGURE 3.
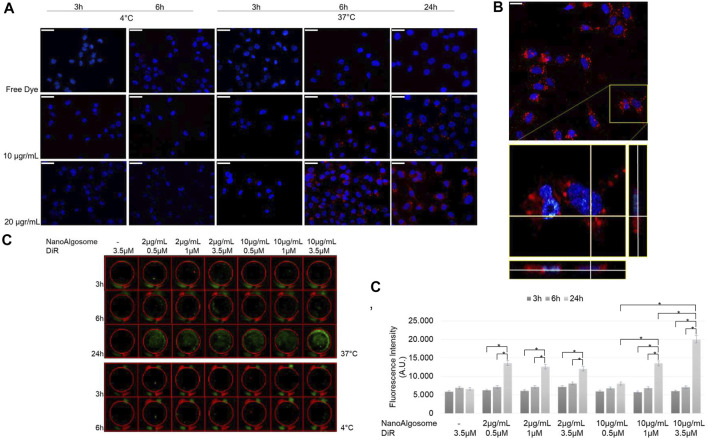
Nanoalgosome cellular uptake in vitro.(A) Representative fluorescence microscopy images showing the cellular uptake of PKH26-fluorescent nanoalgosomes (red) in MDA-MB 231 cells (nuclei in blue) incubated with different concentrations of PKH26-labelled nanoalgosomes (10 and 20 μg/ml) at 37°C for 3, 6 and 24 h. The free dye control and 4°C incubations are shown as negative controls (Magnification 40X). Scale bar 50 µm. (B) Confocal microscopy analysis of PKH26-labelled nanoalgosome internalisation in MDA-MB 231 cells (nuclei in blue) incubated with 20 μg/ml of red fluorescent nanoalgosomes at 37°C for 24 h. The inset of confocal Z-stack acquisition shows its orthogonal projections at a focal depth of 9 μm over a total scanning thickness of ∼18 μm (Magnification 60X). Scale bar 25 µm. (C) Representative infra-red scanner images showing the cellular uptake of DiR-labelled nanoalgosomes (green) in MDA-MB 231 cells incubated with different concentrations of DiR-labelled nanoalgosomes at 37°C for 3, 6 and 24 h. The corresponding IR fluorescence intensities are measured in triplicate (*p < 0.0001) and reported (C’) through the in-cell function of Odyssey V3.0 software. Free dye and 4°C incubations are shown as negative controls.

