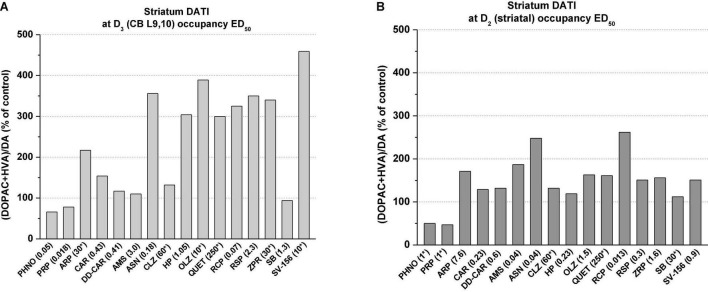
FIGURE 5.
Graphical presentation of percent changes in striatal dopamine turnover indices (DATI) at D3R (i.e., cerebellar L9, 10) occupancy ED50 doses (A) and at D2R (i.e., striatal) occupancy ED50 doses (B) in vivo*,#. *Doses in brackets denote the occupancy ED50 doses (or close to ED50) taken from Table 2. Dopamine turnover index (DATI) was estimated from turnover dose-response curves (consisting of at least 4–5 doses, with five rats in each dose-group) for individual compounds listed in this figure. In cases where the occupancy ED50 values could not be exactly calculated (see Table 2) the turnover indices were determined at doses denoted with asterisks. Dopamine turnover index was defined as DA/(DOPAC+HVA). Determination of tissue dopamine, DOPAC and HVA was carried out exactly as described in Kiss et al. (22) (for abbreviations of drugs’ names, see Table 2). #Dopamine turnover data for cariprazine and DD-CAR were published in Kiss et al. (173). Turnover results of other compounds are unpublished and are on file at G. Richter. Plc.

