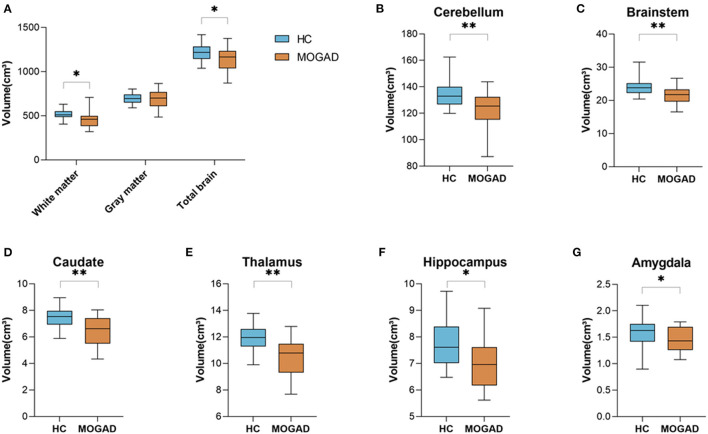
Figure 1.
Decreased brain volume in MOGAD patients compare to HCs. Brain volume of HCs (n = 22) and MOGAD patients (n = 22) analyzed by Volbrain software. (A) Volume of white matter (512.56 ± 57.33 vs. 458.68 ± 89.60, p = 0.018), gray matter (699.97 ± 59.45 vs. 681.66 ± 106.70, p = 0.476) and total brain (1,214.14 ± 105.65 vs. 1,139.91 ± 135.15, p = 0.048), and volume of (B) cerebellum (134.64 ± 10.28 vs. 124.17 ± 12.42, p = 0.007), (C) brainstem (23.96 ± 2.55 vs. 21.61 ± 2.45, p = 0.003), (D) caudate (7.46 ± 0.79 vs. 6.56 ± 1.03, p = 0.001), (E) thalamus (11.97 ± 0.98 vs. 10.74 ± 1.72, p = 0.008), (F) hippocampus (7.78 ± 0.83 vs. 6.86 ± 1.27, p = 0.011), and (G) amygdala (1.60 ± 0.27 vs. 1.37 ± 0.36, p = 0.024) of MOGAD patients and HCs. MOGAD, Myelin oligodendrocyte glycoprotein antibody disorders; HCs, healthy controls. p * ≤ 0.05, ** ≤ 0.01.

