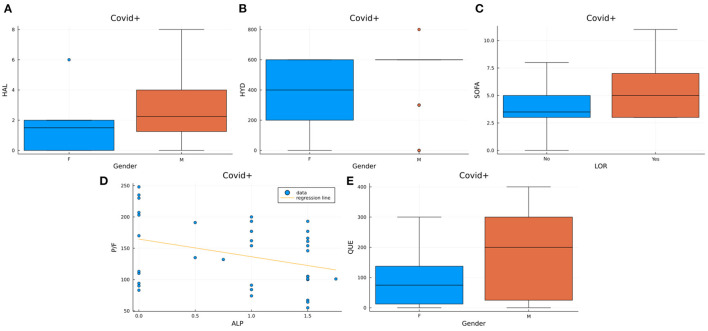
Figure 3.
Visualization of the significant results from the correlations in the COV+/DEL+ group. Box plots represent the distribution of haloperidol (Figure 2A), quetiapine (Figure 2E) and hydroxyzine (Figure 2B) maximum dosages for each sex, SOFA scores in subjects assuming LOR vs. subjects not assuming LOR (Figure 2C). The scatter plot with regression line (Figure 2D) represents the distribution of P/F values vs. the maximum dose of alprazolam used. HAL, Haloperidol; HYD, Hydroxyzine; SOFA, Sepsis-related Organ Failure Assessment; P/F, PaO2/FIO2; QUE, Quetiapine; LOR, Lorazepam; ALP Alprazolam.

