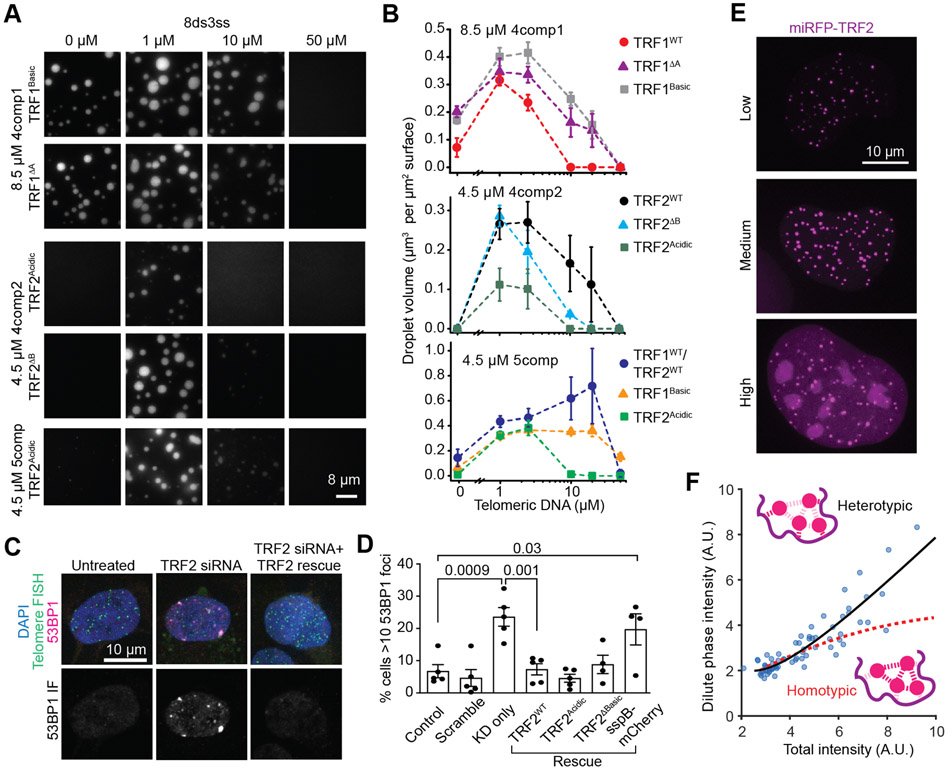
Figure 5. Telomeric condensates exhibit quantitative signatures consistent with multicomponent phase-separated liquids both in vitro and in living cells.
A. Example images show phase separation of 4comp1, 4comp2, and 5comp assembled using N-terminal swap or truncation mutants of TRF1 and TRF2. B. The total volume of shelterin droplets assembled with native or mutant TRF1 and TRF2 settled per micron squared area on the coverslip under different 8ds3ss concentrations (mean ± SD, n = 20 with two technical replicates). C. 53BP1 staining (magenta) of hTERT-RPE1 cells that are treated or untreated with TRF2 siRNA. Telomeres are stained with a telomeric DNA FISH probe (green). Nuclei are labeled with DAPI (blue). D. The percentage of hTERT-RPE1 cells with more than 10 53BP1 foci per nucleus under knockdown and rescue conditions. Error bars represent SEM of five biological replicates for all conditions except for TRF2ΔB and sspB-mCherry (four replicates). n > 1000 cells analyzed for all conditions. P-values were calculated by one-way ANOVA with multiple comparisons. E. Overexpression of miRFP-TRF2 leads to an increased dilute phase (nucleoplasmic) partitioning in U2OS cells. F. The dilute phase intensity increases nonlinearly as a function of the total intensity of the miRFP-TRF2 signal in U2OS cells. The data fit to a nonlinear heterotypically stabilized model (black solid curve) but not to homotypic interactions (red dashed curve). The ‘homotypic’ curve is not a flat line due to the presence of endogenous protein (see Riback et al., 2020). See also Figure S5.

