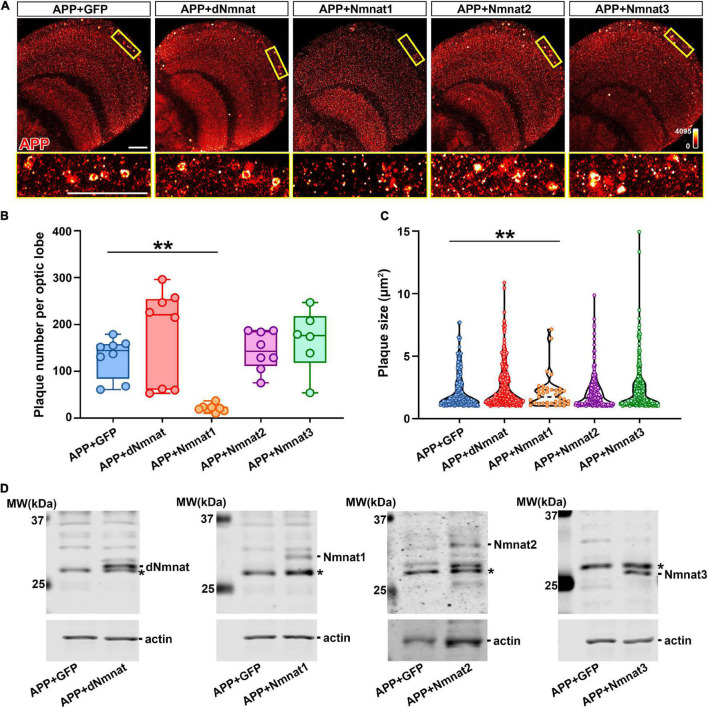
FIGURE 2.
hNmnat1 reduces the accumulation of amyloid plaques in the brain. (A) Top row: APP staining (heatmap) of brains of flies expressing APP + GFP, APP + dNmnat, APP + hNmnat1, APP + hNmnat2, or APP + hNmnat3 at 60 DAE. Bottom row: higher magnification images of the boxed areas in the top row. Scale bars = 30 μm. (B) Scatter plot showing quantification of the number of amyloid plaques in panel (A). The whiskers represent the minimum and maximum values of the dataset. One-way ANOVA with Bonferroni’s post hoc test. n = 6–8/group, **P < 0.01. (C) Violin plot showing quantification of the size of amyloid plaques in panel (A). One-way ANOVA with Bonferroni’s post hoc test. **P < 0.01. (D) Western blot analysis showing expression of Nmnat isoforms in fly brains at 60 DAE. Actin is used as an internal control. * Indicates a non-specific band.

