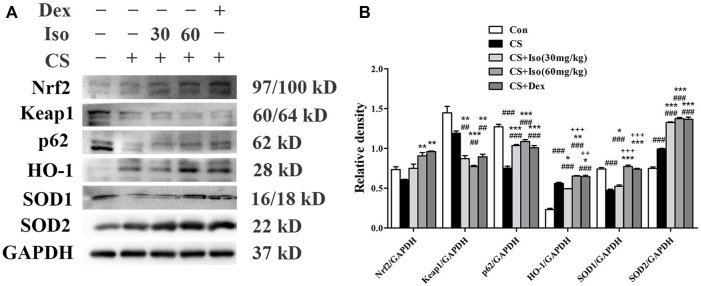
FIGURE 9.
Iso regulates the Nrf2/Keap1 pathway in CS-induced COPD mice. (A) The protein expression levels of Nrf2, Keap1, p62, HO-1, SOD1, and SOD2 were measured by western blotting, respectively. GAPDH was used as the internal reference. (B) The band intensities of Nrf2, Keap1, p62, HO-1, SOD1, and SOD2 were semiquantified using ImageJ (n = 3 mice per group). Data was shown as mean (±SD) (B). To test for group differencses one-way ANOVA (B) was applied. ## p < 0.01, ### p < 0.001 vs. control group, *p < 0.05, **p < 0.01, ***p < 0.001 vs. CS group and ++ p < 0.01, +++ p < 0.001 vs. CS + Iso 30 mg/kg group.

