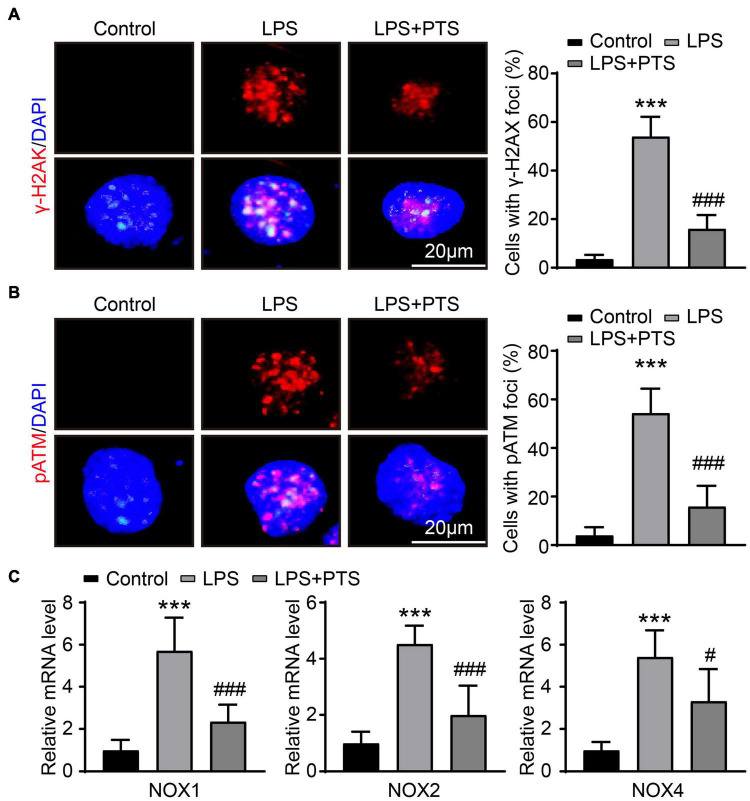
FIGURE 5.
PTS reduces oxidative stress in LPS-Induced H9C2 cells. (A) Representative of γ-H2AX and DAPI from control group, LPS group, and LPS + PTS group on the left and quantitative data are shown on the right (n = 6). (B) Representative of p-ATM and DAPI from control group, LPS group, and LPS + PTS group on the left and quantitative data are shown on the right (n = 6). (C) The mRNA levels of NOX1, NOX2, and NOX4 in heart tissue from control group, LPS group, and LPS + PTS group were detected by qPCR (n = 6). ***P < 0.001 control vs. LPS, #P < 0.05, ###P < 0.001 LPS vs. LPS + PTS.

