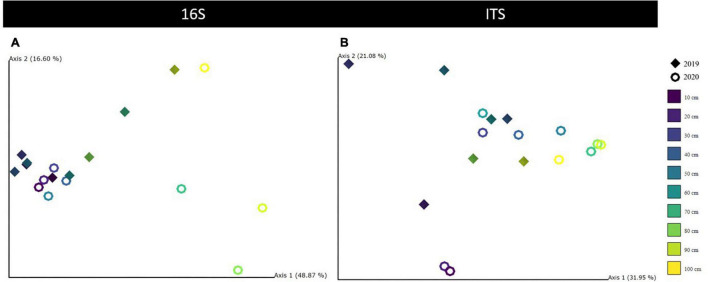
FIGURE 4.
Principal coordinate analysis (PCoA) results were visualized with QIIME2 Emperor plots for 16S (A) and ITS (B) Unifrac distances along the first two axes, each depicting the variability explained in %. Diamonds are used for 2019 and rings for 2020 measurements. Different colors indicate the 10-cm depth horizons. All other soil parameters were tested and summarized in Supplementary Figure 2 (16S) and Supplementary Figure 3 (ITS).

