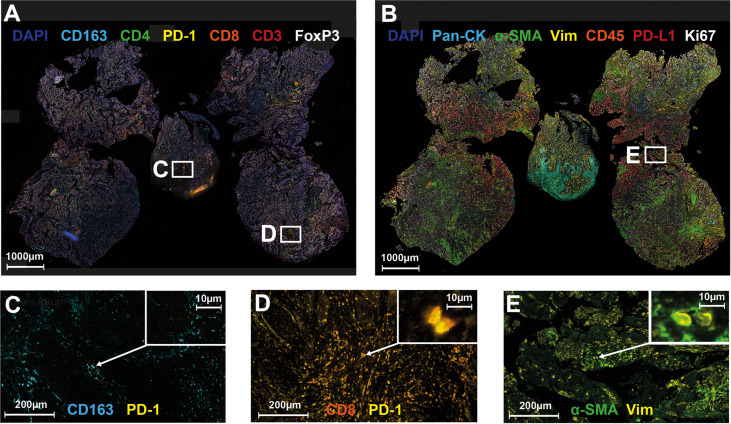
Figure 4.
Multiplex Immunohistochemistry and Cell Types Associated with Poor Response to Neoadjuvant Chemoradiotherapy. Representative overview of the T-cell antibody panel (A) and the TME panel (B), and exemplary images of cell types with association to tumor response to neoadjuvant chemoradiotherapy (C–E). Nuclei were counterstained with DAPI (blue). (A) T-cell panel: CD163 (cyan), CD4 (green), PD-1 (yellow), CD8 (orange), CD3 (red), FoxP3 (white); (B) TME panel: Pan-CK (cyan), aSMA (green), Vimentin (yellow), CD45 (orange), PD-L1 (red), Ki67 (white); (C) PD-1 positive macrophage; (D) PD-1 positive cytotoxic T-cell; (E) Cancer-associated fibroblast.

