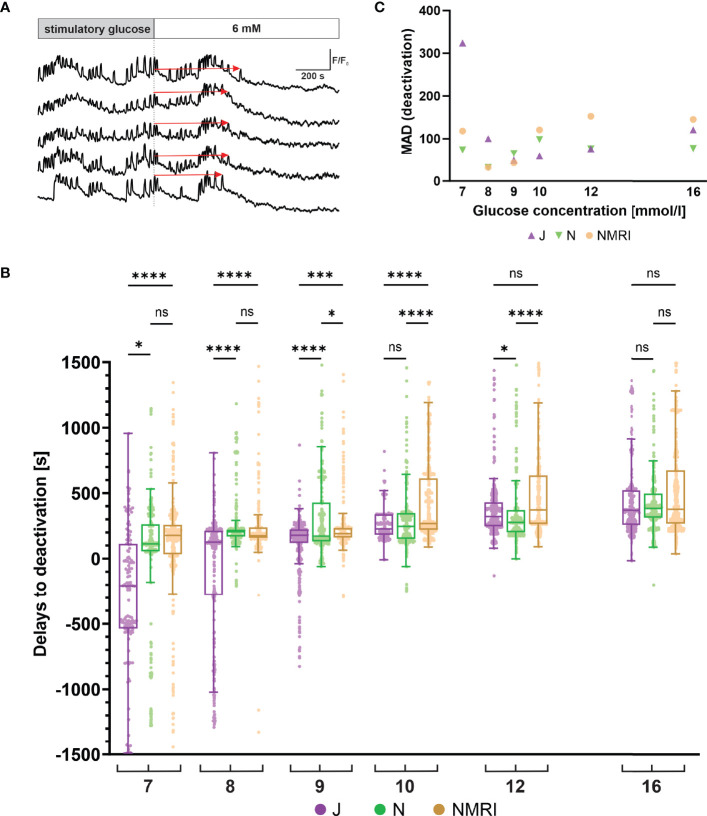
Figure 4.
Glucose-dependent deactivation delays of beta cells in C57BL/6J, C57BL/6N and NMRI strains. (A) Schematic representation of delays to deactivation (red arrow) measured as the time difference between end of stimulation (dashed line) and the last [Ca2+]i oscillation. (B) Delays to deactivation in C57BL/6J (median -208, 126, 179, 227, 322, and 370 s), C57BL/6N (median 113, 206, 173, 248, 277, and 386 s), and NMRI (median 178, 175, 190, 269, 373, and 378 s) in 7-, 8-, 9-, 10-, 12-, and 16-mM glucose, respectively. (C) Variability in deactivation delays, expressed as median absolute deviation (MAD) after stimulation with 7-, 8-, 9-, 10-, 12-, and 16-mM glucose. MAD values (in seconds): C57BL/6J: 324 (7 mM), 100 (8 mM), 49 (9 mM), 59 (10 mM), 77 (12 mM), and 120 (16 mM), C57BL/6N: 74 (7 mM), 32 (8 mM), 65 (9 mM), 98 (10 mM), 76 (12 mM), and 77 (16 mM), NMRI: 118 (7 mM), 32 (8 mM), 43 (9 mM), 121 (10 mM), 153 (12 mM), and 145 (16 mM). Pooled data (coded as C57BL/6JC57BL/6NNMRI) from the following number of cells/islets/pancreas preparations: 133/6/5| 377/12/6| 472/12/6 (7mM glucose), 288/10/7| 832/8/5| 482/11/6 (8 mM glucose), 544/10/7| 700/9/5| 792/10/6 (9 mM glucose), 307/5/4| 711/9/5| 999/10/6 (10 mM glucose), 546/10/6| 676/11/6| 749/10/6 (12 mM glucose), and 657/11/6| 592/7/5| 809/10/6 (16 mM glucose). Where present, the following symbols in indicate p-values: *p < 0.05, **p < 0.01, ***p < 0.001, ****p < 0.0001; ns, not significant.

