. 2022 Apr 7;12(18):10950–10988. doi: 10.1039/d1ra08311b

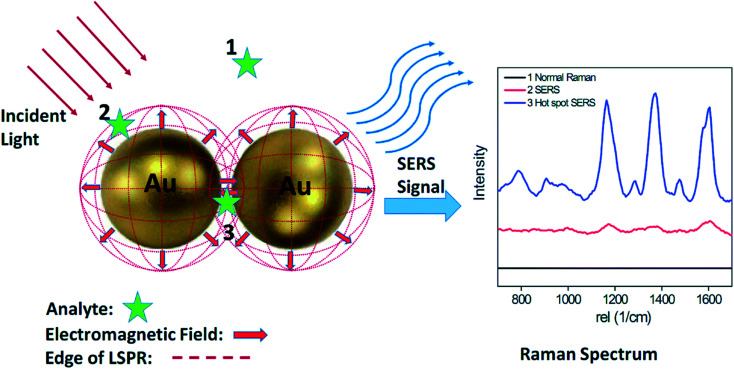
Fig. 6. Schematic of SERS phenomenon for an organic analyte on AuNPs. Analyte molecules located within the dotted red circles (position 2 and 3) show clear Raman signals, while analytes located outside the circles (position 1) exhibit no detectable Raman signal. Commonly, significant Raman enhancements mainly occur within gaps smaller than 10 nm. These localized areas are often referred to as ‘hot-spots’ (position 3). Analyte molecules located within the hot spot exhibit a much stronger Raman signal than those located on AuNP surface (position 2). Reproduced from ref. 107 with permission from The Royal Society of Chemistry, Copyright 2015.

Fig. 6