Figure 2.
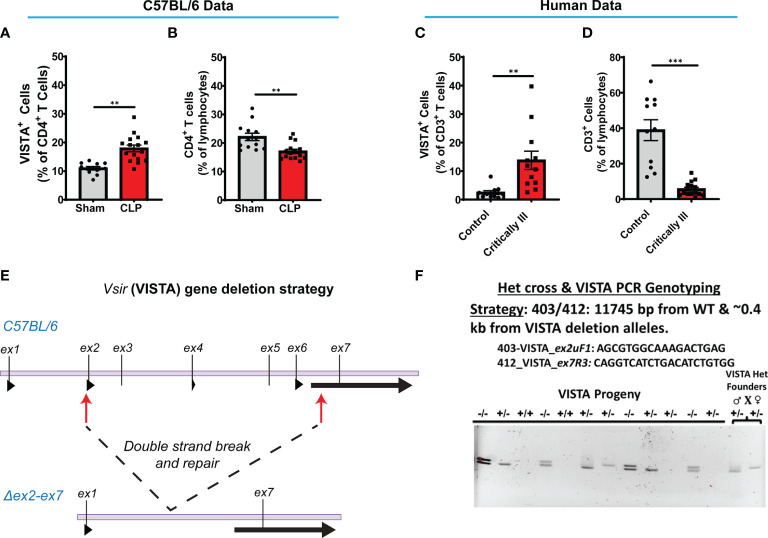
VISTA+CD4+ T cells in mouse splenocytes and VISTA+CD3+ lymphocytes in patient blood increase following experimental or clinical sepsis. (A) Summary graph of VISTA+ CD4+ T cells in the wild-type mouse spleen. (B) Summary graph of CD4+ T cell frequency in the wild-type mouse spleen. (C) Summary graph of VISTA+ CD3+ T cell frequency in the peripheral blood lymphocytes. (D) Summary graph of CD3+ T cell frequency in the peripheral blood. (A–D) Summary graphs show mean ± SEM [WT-sham: n = 13, WT-CLP: n = 16]; significance **p < 0.01, ***p < 0.001. (E) Initial process (Strategy) for producing embryos deficient in the ~11.3-kb region containing exon (ex) 2 to exon 7 of the VISTA gene on mouse chromosome 10 with CRISPR/Cas9 followed by NHEJ-mediated repair. (F) Results of initial heterozygous cross of VISTA-/+ founder mice resulting from CRISPR/Cas9 technology that produced homozygous VISTA-/- mice for breeding (PCR genotyping strategy: 403/412: 11,745 bp from WT and ~0.4 kb from VISTA deletion alleles).

