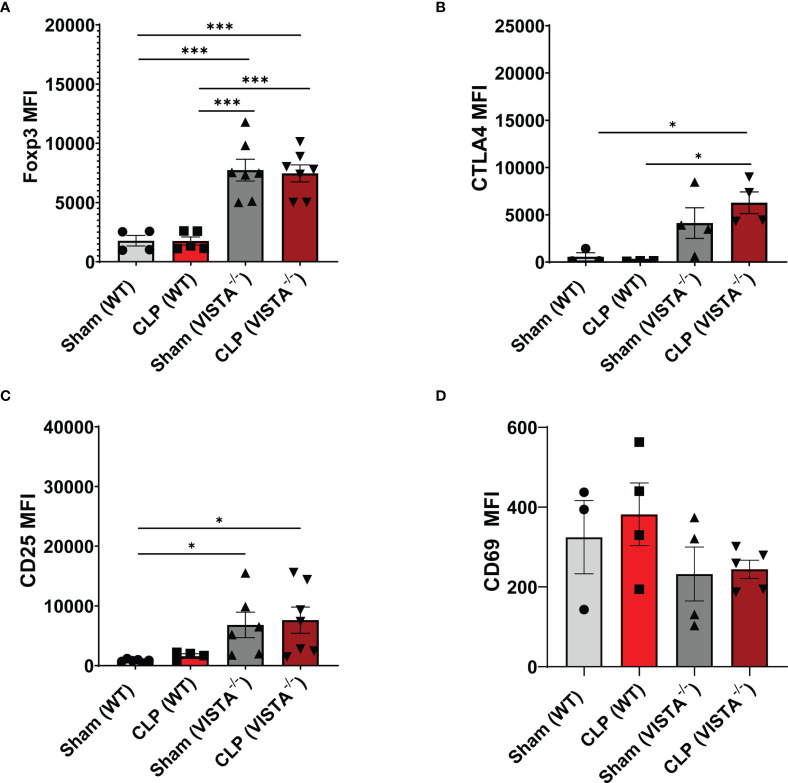
Figure 5.
Expression of suppressive markers is upregulated on CD4+ Tregs in the spleen of VISTA-/- mice. Median fluorescence intensity (MFI) of (A) Foxp3, (B) CTLA4, (C) CD25, and (D) CD69 on CD4+ Tregs in the spleen. Summary graphs show mean ± SEM [WT-sham: n = 3, WT-CLP: n = 3, VISTA-/-sham: n = 4, VISTA-/- -CLP: n = 4]; significance *p < 0.05; ***p < 0.001.

