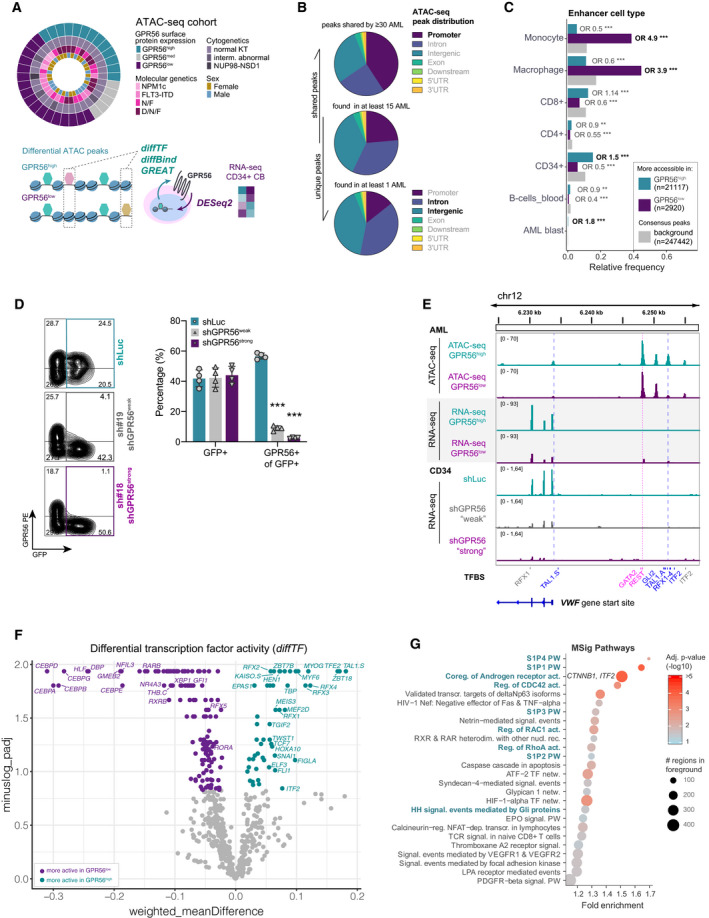
Overview of the experimental and analytical setup. ATAC‐seq was performed on 35 AML samples comprising the mutational groups N: NPM1 mutated, F: FLT3‐ITD, N/F: NPM1/FLT3‐ITD, D/N/F: DNMT3A/NPM1/FLT3‐ITD. Indicated colors represent GPR56 protein expression grouped into high (> 70% GPR56+ cells per sample, n = 13), medium (30%–70% GPR56+, n = 5), and low (< 30% GPR56+, n = 17), cytogenetic and molecular genetic characteristics, and gender. ATAC‐seq data were subjected to the computational pipelines diffTF, diffBind, and GREAT. RNA‐seq was performed on cord blood (CB) CD34+ cells after GPR56 knockdown and analyzed by DESeq2. The combined information was used to identify differential TF and signaling pathway activities up‐ and downstream of GPR56.
Pie charts showing the distribution of ATAC‐seq peaks shared by most samples (top), by at least 15 samples (middle), and those present in at least one sample. Colors indicate the different genomic regions. Chromatin regions that are rather differentially accessible (bottom) are enriched for introns and intergenic regions, which often contain regulatory elements, while shared peaks are more often located in promoter regions (top).
ATAC‐seq peaks more accessible in GPR56low (violet) or GPR56high (turquoise) against the background (gray) are enriched for enhancers associated with specific hematopoietic cell types. P‐values and odds ratios are given for a pairwise, two‐sided Fisher’s Exact test comparing each category (GPR56low/high) against the background. Enhancer annotations are taken from EnhancerAtlas 2.0. ***P < 0.0005, **P < 0.005, *P < 0.05.
Knockdown efficiency of two shRNAs against GPR56 (shGPR56weak and shGPR56strong) versus shLuc as negative control measured on protein level by flow cytometry in CD34+ CB cells. Shown are representative FACS plots (left) and the percentage of GPR56+ cells of transduced GFP+ cells on day 5 (right panel). Biological replicates N = 4, unpaired t‐test, bars and error bars represent mean and SD. ***P < 0.0005, **P < 0.005, *P < 0.05.
Integrative Genome Viewer (IGV) snapshot showing ATAC‐seq peaks along and upstream of the VWF gene in GPR56high vs. lowsamples (top, average peak size of 10 GPR56high (turquoise) and 15 GPR56low samples (violet)), RNA‐seq reads of the same location in AML samples with high (n = 9) versus low (n = 11) GPR56 expression (two middle tracks), and RNA‐seq reads of shLuc versus GPR56 knockdown CD34+ cells (3 bottom tracks, one of two replicates shown for each condition). Track height was group‐scaled. Dashed vertical lines indicate binding sites for the annotated TFs. TFBS: transcription factor‐binding site derived from the HOCOMOCO v10 database; TSS: transcription start site. TFs in blue bind to differentially accessible chromatin regions.
Volcano plot of differential TF motif accessibility (activity) in GPR56high (turquoise) vs. GPR56low (violet) samples and their corresponding adjusted P‐values determined with diffTF. Highlighted are TFs whose RNA expression was also positively or negatively affected by GPR56 KD in the RNA‐seq dataset.
Pathway enrichment analysis for peaks that are more accessible in GPR56high AML. The GREAT algorithm was used to assign peaks to genes, the MSig database was used for pathway enrichment analysis (Pathway Interaction Database). Shown are all terms with adjusted P‐value < 0.05. PW: pathway, (Co‐)reg.: (Co‐) regulation, act.: activity, NR: nuclear receptor, transcr.: transcription(al), netw.: network, signal.: signaling.

