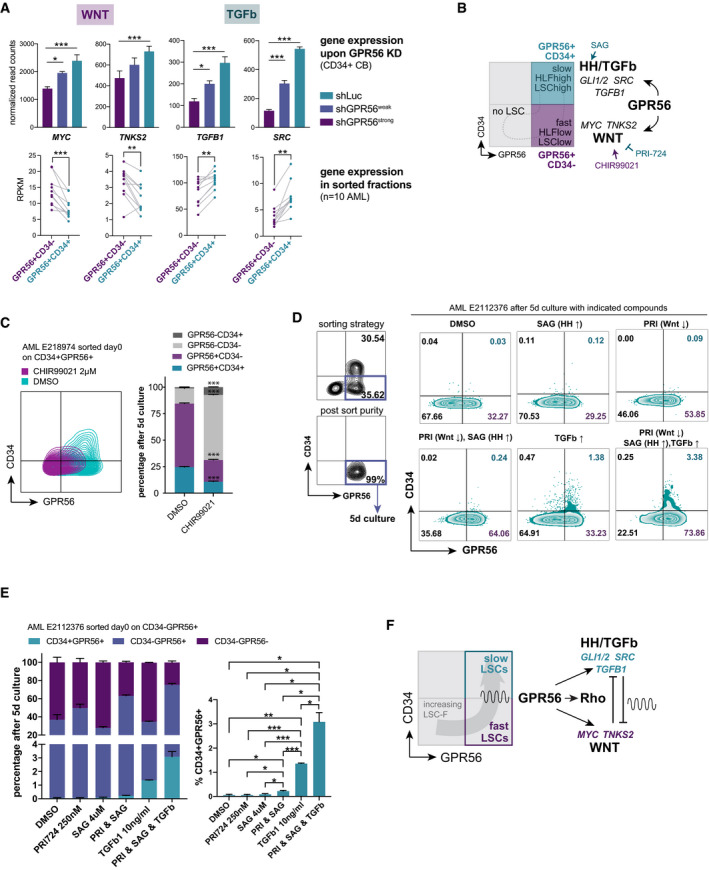
Figure 4. TGFb, HH, and Wnt pathway activities determine the balance between the GPR56+CD34+ and GPR56+CD34− LSC compartments.

- RNA‐seq after GPR56 KD in CD34+ CB cells reveals that GPR56 enhances gene expression displayed as reads per kilobase per million mapped reads (RPKM) of MYC, TNKS2, TGFB1, and SRC (top). Previously published RNA‐seq of ten sorted CD34+GPR56+ versus CD34−GPR56+ fractions (Garg et al, 2019) shows a divergent expression pattern: downregulation of Wnt targets MYC and TNKS, but upregulation of TGFB1 and SRC in the CD34+GPR56+ fraction. Unpaired t‐test, bars, and error bars represent mean and SD of three biological replicates, ***P < 0.0005, **P < 0.005, *P < 0.05.
- Cartoon visualizing that GPR56 enhances genes and pathways differentially active in the CD34+GPR56+ fraction, which is characterized by slow cell cycle progression, high LSC frequency, and high expression of the stemness gene HLF versus the CD34−GPR56+ cells, which are more differentiated (lower LSC frequency), cycle faster, and have little HLF expression. Arrows and blocked arrows indicate activation or inhibition by the indicated small molecules, respectively, which were used in subsequent experiments.
- Contour FACS plots (left) and summary bar graph (right) showing CD34 and GPR56 expression after 5‐day culture of purified CD34+GPR56+ cells from AML sample E218974 with CHIR99021 or vehicle DMSO, Unpaired t‐test, bars, and error bars represent mean and SD of three technical replicates, ***P < 0.0005.
- Left: FACS profile and sorting strategy for the CD34‐GPR56+ fraction (top), and post‐sort purity (bottom) of AML sample E2112376 on the day of thawing. Right: CD34 and GPR56 expression measured by flow cytometry 5 days post exposure of purified CD34‐GPR56+cells to the indicated molecules or their combinations. PRI: PRI‐724, arrows indicate whether the pathway is inhibited (↓) or activated (↑) by the compound.
- Left: Bar graph showing the distribution of CD34 and GPR56 fractions at the end of the 5‐day culture of purified CD34−GPR56+ cells from AML E2112376 with indicated compounds. Right: statistical analysis shown only for the CD34+GPR56+ fraction. See Dataset EV11 for full statistical analysis. PRI: PRI‐724, Unpaired t‐test, bars, and error bars represent mean and SD of three individual treatments, ***P < 0.0005, **P < 0.005, *P < 0.05.
- Cartoon visualizing the proposed mechanism by which both GPR56+ LSC‐enriched compartments are maintained: GPR56 enhances pathways, which reciprocally inhibit each other and are differentially active in the two fractions. This should result in a constant transition between the compartments and thus prevent exhaustion of the two populations.
