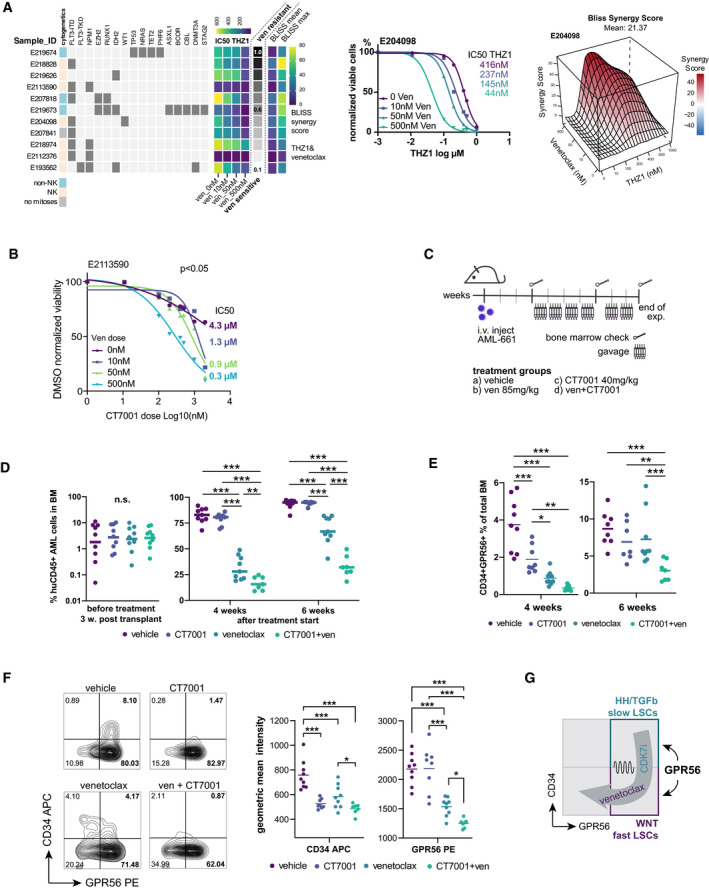
Figure 6. Synergism of CDK7 inhibitors with venetoclax.

- Left: Eleven primary AML specimens with different cytogenetic and molecular genetic aberrations (see Dataset EV12 for details) were treated with THZ1 or YKL‐5‐124 alone or in combination with venetoclax. IC50 values in presence of increasing doses of venetoclax are visualized for THZ1. The gray‐scale bar indicates the fraction of viable cells in presence of a high dose of venetoclax (500 nM) compared with DMSO to provide an approximation whether a sample was rather sensitive or resistant against venetoclax alone. Note that the addition of venetoclax reduces the IC50 in all samples regardless of their baseline resistance against venetoclax alone. The last four columns provide the average and maximum BLISS scores reached by a combination of THZ1 and venetoclax (N = 11) Middle: representative dose‐response curves of THZ1 in presence of increasing doses of venetoclax for one primary AML specimen with intermediate venetoclax sensitivity. Right: representative 3D‐synergy plot showing the BLISS synergy scores at indicated concentrations of THZ1 and venetoclax for AML E204098.
- Dose‐response curve for the CDK7i CT7001 in presence of increasing doses of venetoclax for primary AML E2113590. The indicated doses on the right represent the IC50 dose.
- Schematic visualizing the setup for the combinatory in vivo treatment. AML‐661 cells were injected in NSG mice. Bones indicate the timepoints of bone marrow aspirations to monitor engraftment of human leukemic cells in mice before treatment start and during treatment.
- Percentage of human CD45+ leukemic cells three weeks post injection, i.e. before treatment start (left), and 4 and 6 weeks after treatment start (right). Dots represent individual mice, horizontal lines represent means. Unpaired t‐test, ***P < 0.0005, **P < 0.005.
- Percentage of human CD34+GPR56+ cells in the mouse bone marrow at 4 and 6 weeks post treatment start with the indicated compounds. Dots represent individual mice, horizontal lines represent means. Unpaired t‐test, ***P < 0.0005, **P < 0.005, *P < 0.05.
- Left: Representative FACS plots showing CD34 and GPR56 expression on AML cells after 4‐week treatment with the indicated compounds. Right: Statistical analysis of the geometric mean intensity of CD34 APC (left) and GPR56 PE (right) in the four treatment groups. Horizontal lines represent means. Unpaired t‐test, ***P < 0.0005, **P < 0.005, *P < 0.05.
- Cartoon visualizing how CDK7i and venetoclax synergize to suppress both GPR56+ compartments in AML.
