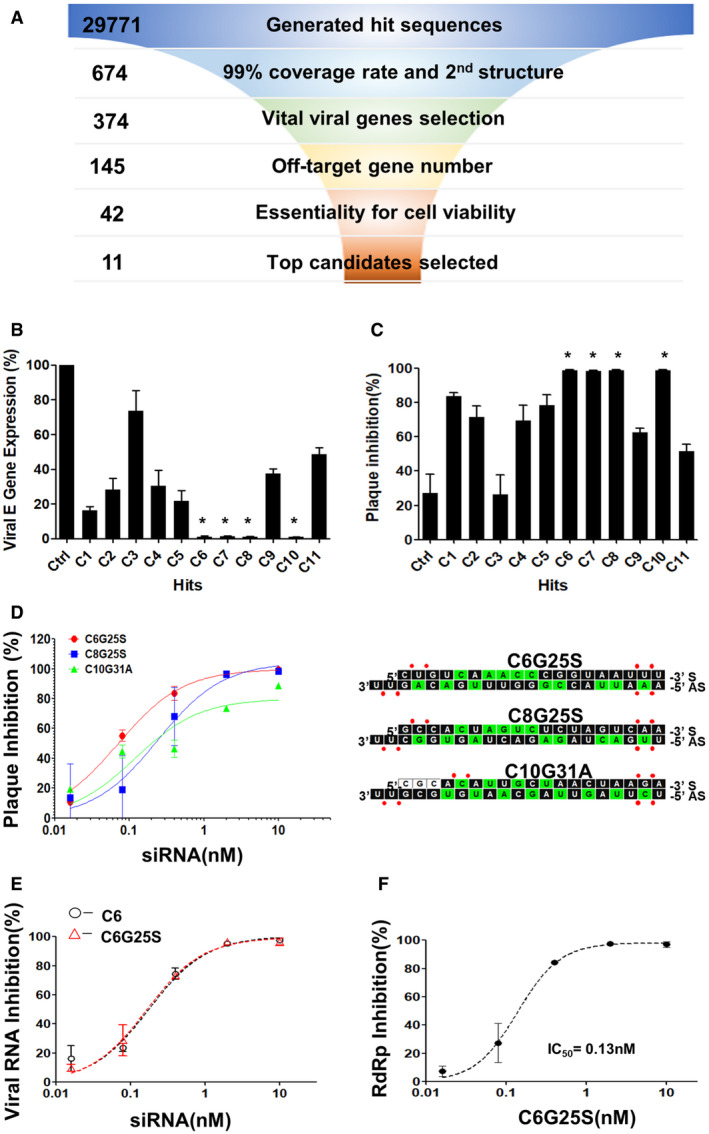
Figure 1. Selection of a highly potent siRNA against SARS‐CoV‐2.

- Flowchart for the selection strategy. The selection criteria and sequence numbers remaining at the end of each stage were individually indicated.
- Vero E6 cells were transfected with 10 nM of siRNA before infection by SARS‐CoV‐2 at a multiplicity of infection (MOI) of 0.1 after 24 h. The numbers of viral RNA copies were quantitated with RT‐qPCR. The negative control siRNA served as the control and is abbreviated as “Ctrl.” C1–C11 represent the final candidate sequences after selection. The siRNAs capable of inhibiting up to 99% of viral envelope gene expression with P‐values < 0.005 compared with Ctrl siRNA are marked with *. P‐value by Student’s t‐test.
- Vero E6 cells were transfected with 10 nM of siRNA before infection by SARS‐CoV‐2 at a MOI of 0.1 after 24 h. The number of infectious virions were quantitated with plaque‐forming assay. The siRNAs capable of inhibiting up to 99% of plaque‐forming virions production with P‐values < 0.0001 compared with Ctrl siRNA are marked with *. P‐value by Student’s t‐test.
- IC50 and sequences of modified siRNA C6G25S, C8G25S, and C10G31A. Vero E6 cells were transfected with 10, 2, 0.4, 0.08, or 0.016 nM of each modified siRNA and challenged with virus at MOI of 0.1. Plaque‐forming virions were detected 24 h after infection. The sequences and chemical modifications of sense (S) and antisense (AS) strand of each siRNA are presented with 2′‐F and 2′‐OMe modifications as green and black squares, respectively. No modified RNA residues and phosphorothioate interlinkages are depicted as white squares and red dots, respectively.
- IC50 of C6 and the fully modified C6G25S. Vero E6 cells were transfected with 10, 2, 0.4, 0.08, or 0.016 nM of C6 or C6G25S before virus infection at an MOI of 0.1. The viral RNA was quantitated by RT‐qPCR at 24 h after infection.
- IC50 data for viral RdRp inhibition by C6G25S. Vero E6 cells were transfected with 10, 2, 0.4, 0.08, or 0.016 nM of C6G25S before virus infection at an MOI of 0.1. The viral RNA was quantitated by RT‐qPCR at 24 h after infection.
Data information: Data were analyzed with GraphPad Prism 5 software and presented as mean ± SD of three biological replicates in (B–F).
