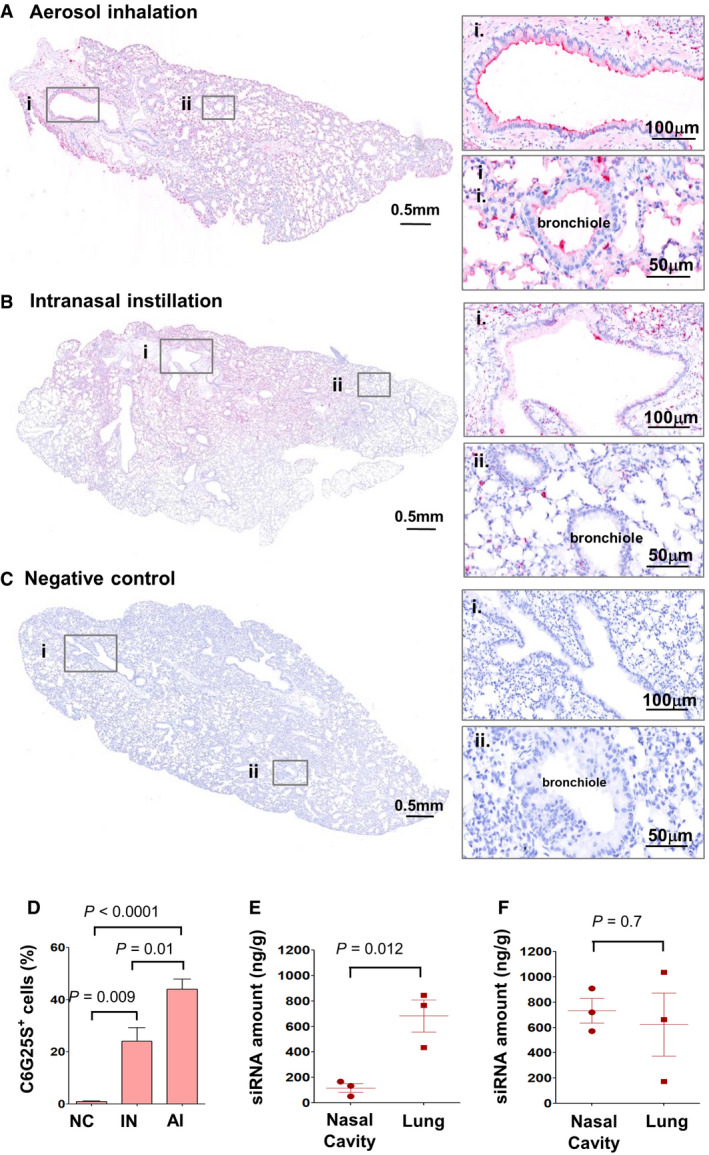
Figure 3. In vivo study of administration route for C6G25S.

-
A–CK18‐hACE2‐transgenic mice treated with C6G25S by 1.48 mg/l of AI for 30 min (A), 50 μl of saline containing 50 μg of C6G25S by IN (B), or PBS (C) (n = 5 per group). C6G25S distribution in lungs was visualized by in situ hybridization (ISH) staining with C6G25S‐specific probe (red color). Bronchi (i) and bronchioles (ii) marked with the boxes are enlarged on the right.
-
DQuantitation of C6G25S‐positive cells in lungs of (A), (B), and (C). Quantitation data represent mean ± SD (n = 5 per group). P‐value by Student’s t‐test.
-
E, FC57/B6 mice (n = 3 per group) were treated by AI with C6G25S 1.48 mg/l for 30 min (E) or 50 μl of saline containing 50 μg of C6G25S by IN administration (F). The C6G25S deposited in whole lungs and nasal cavities was quantitated after whole tissue homogenization followed by stem‐loop RT‐qPCR. Quantitation data represent mean ± SD. P‐value by Student’s t‐test.
Source data are available online for this figure.
