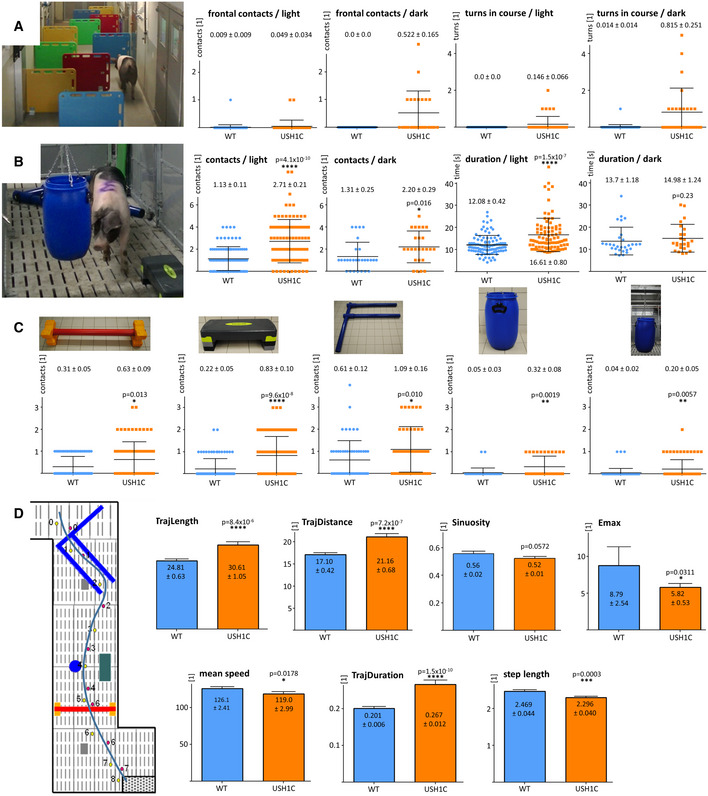
A–CCohorts of animals were trained for specific parcour settings and then examined in repeated runs. Setting of hurdles was changed between the runs. Time and snout contacts were monitored. Analysis included all runs, except those in which the experimental pig did not meet the compliance criteria. Data points are plotted, lines indicate mean values (MV) ± SD, numbers give MV ± SE in addition. In a barrier course (A), different arrangements of shields (see Appendix Fig S4A) were used to challenge orientation. Only minor differences between WT (blue) and USH1C (orange) pigs were observed in the dark or under normal light conditions. Data points are summarized for two separate groups at 5–12 months of age (1 USH1C, 1 WT in 25 runs in the dark and 16 runs under light; 1 USH1C, 6 WT in 16 runs in the dark and 11 runs under light). (B) In a similar approach, different obstacles were placed instead of shields (see Appendix Fig S5) and revealed intensified sensing by snout contacts for USH1C pigs in the dark and under light. In the light, WT pigs were also faster. 5 USH1C and 5 age‐matched WT control pigs were examined in 22 runs under light conditions and 6 runs in the dark at 7–12 months of age. Statistical evaluation was performed by two‐tailed Mann–Whitney U‐test (P‐values indicated). For analysis of normalized data sets see Appendix Fig S6. (C) Detached analysis of the tests in the obstacle course (B) revealed that both, hurdles that primarily challenge the vestibular system (red cavaletti, blue F) as well as hurdles daring vision (sideboard, hanging or standing ton) provoked significantly higher alternative orientation by snout contacts for USH1C pigs. Statistical evaluation was performed by two‐tailed Mann–Whitney U‐test (P‐values indicated). *P < 0.05, **P < 0.01, ***P < 0.001, ****P < 0.0001.

