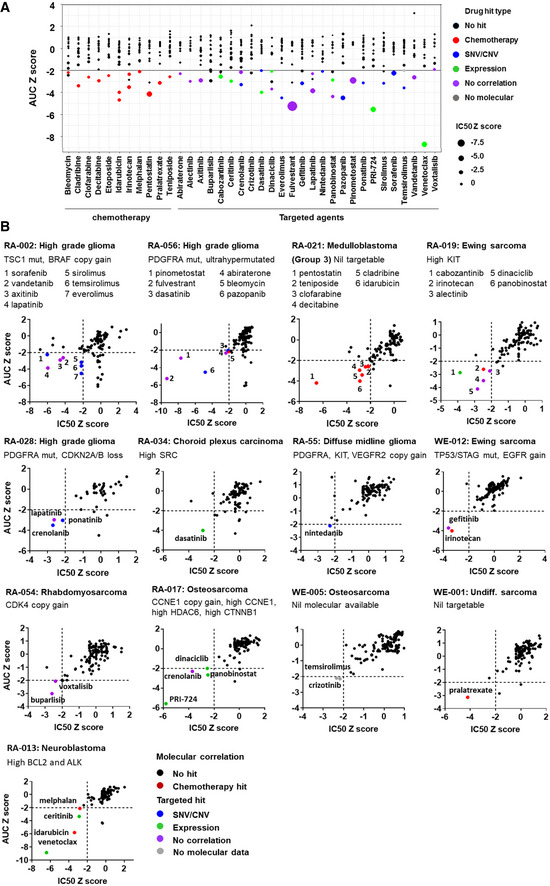
Figure 2. Overview of drug hits identified by high‐throughput drug screening in 13 patient‐derived samples.

- Z score for area under the dose–response curve (AUC) and IC50 of 37 different drugs (shown along the horizontal axis) identified as hits in 13 of 17 samples screened. A drug hit is defined as z score of less than −2 for both AUC and IC50. Each dot in a column represents a sample screened for that drug. The size of the dot corresponds to the IC50 z score for that sample (the larger the dot, the smaller the IC50). Dots below the black horizontal line represent sample with AUC z score of less than −2. Dots are color coded for drug hit types. All color dots below the black line represent a hit for the corresponding drug.
- Plots of AUC z score against IC50 z score for each of the drugs screened in the 13 samples with drug hits.
Source data are available online for this figure.
