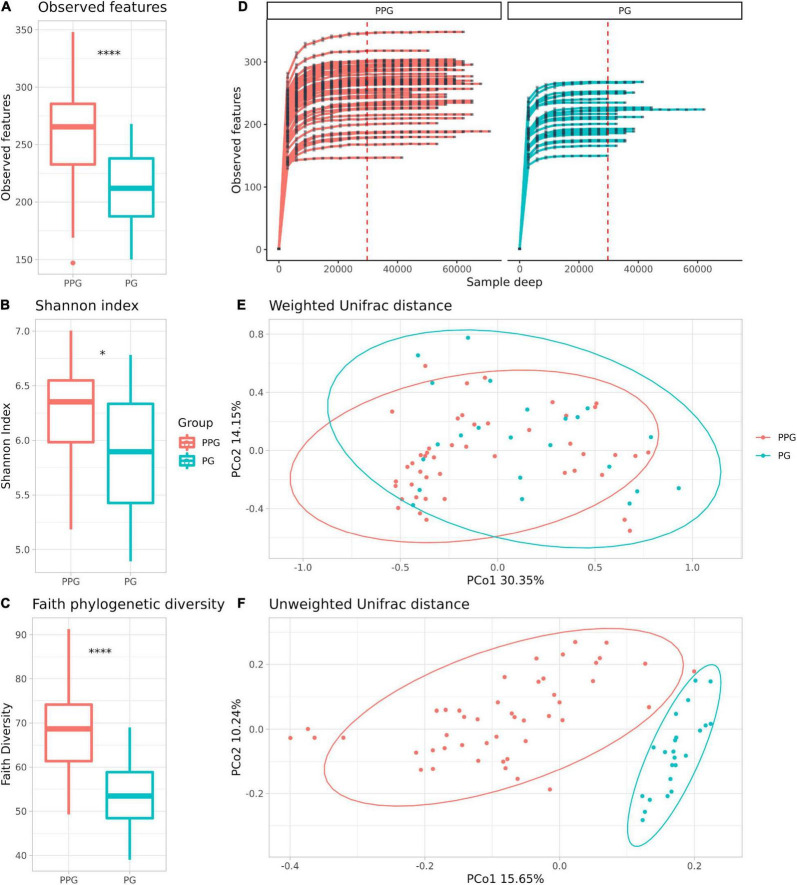
FIGURE 1.
Comparison of the microbiome community of PPG and PG groups. Alpha Diversity measures: Observed features (A), Shannon index on a base-2 logarithmic scale (B) and Faith phylogenetic diversity (C). *p = 0.026; ****p < 0.001. Rarefaction curves of the samples from the PPG and PG (D). The x axis represents the number of sequences sampled while the y axis represents a measure of the species richness detected (estimated number of observed features). The red vertical dotted line represents the rarefaction depth chosen (sample with the least amount of sequences). PCoA plots of beta diversity with weighted (E) and unweighted (F) UniFrac distances, respectively. Ellipses represent the 95% confidence interval of each group. Colors are assigned by group, red for PPG and blue for PG.

