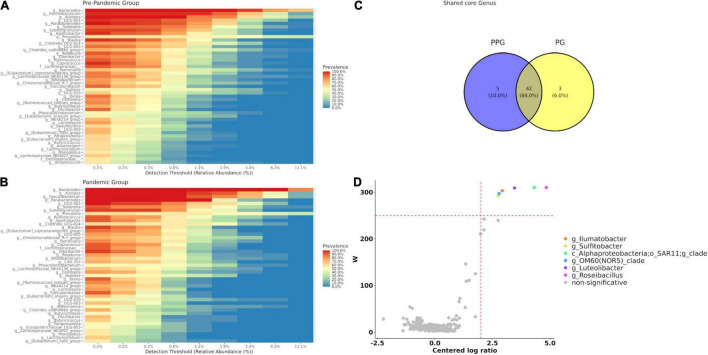
FIGURE 2.
Core microbiome for each group PPG (A) and PG (B). (C) Venn diagram represents shared care genera between groups. Core genera were defined as 0.1% of detection and 50% of prevalence. (D) Volcano plot of the differentially abundant genera between PPG and PG patients. The W-value represents the number of times the null-hypothesis (the average abundance of a given feature in a group is equal to that in the other group) was rejected for a given feature. Red dash lines indicate a significance a priori threshold for differentially abundance set at W ≥ 248 (W > 80% of the total number of genera) and clr (centered logarithmic ratio) > | 2|. Significant genera more abundant in PPG are represented in different colors; whereas non-significant genus are in gray.

