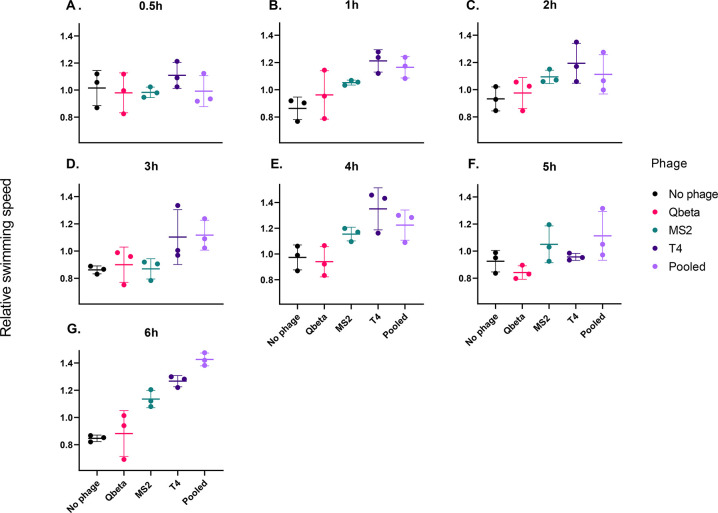
Figure 3.
Phage treatment affects protist swimming speed. Subplots show the relative swimming speed of protists compared to the swimming speed prior to phage addition. A relative swimming speed value of 1 indicates no change in speed upon addition of phages. Each subplot shows data for a different time point (0.5, 1, 2, 3, 4, 5, and 6 h after phage addition). Horizontal bars represent the mean over three replicates, and the error bars represent the standard deviation.

