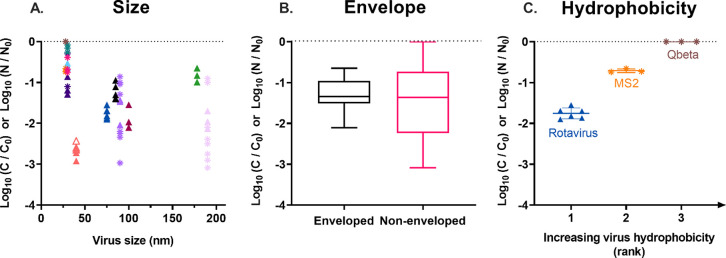
Figure 4.
Net removal (*, log10(C/C0); ▲, log10(N/N0)) of viruses exposed to T. pyriformis for 48 h as a function of different virus properties. Removal data and symbol colors correspond to those in Figure 1. Data points for which the concentration at 48 h was below the LOQ are represented by empty symbols. (A) Net removal as a function of virus size. (B) Box plot of the net removal varlues of all enveloped and all non-enveloped viruses. Boxes indicate the 25th, 50th and 75th percentiles; error bars indicate the 5th and 95th percentiles. (C) Net removal as a function of virus hydrophobicity, ranked according to literature values.50,51 The bars indicate the mean and standard deviation of experimental replicates.

