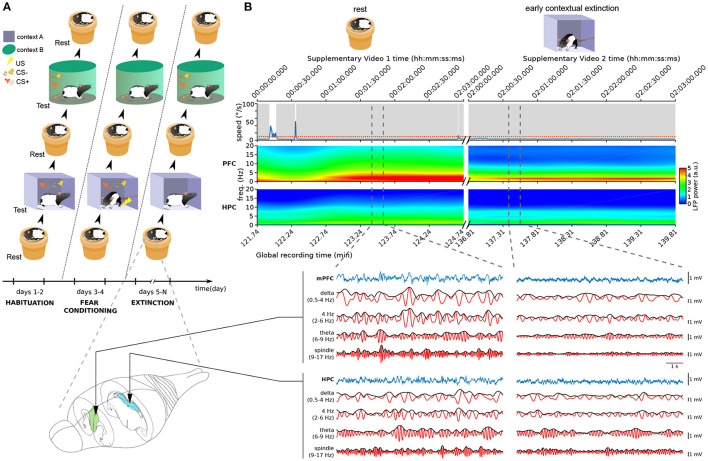
Figure 1.
Neural and behavioral activity during rest vs. freezing (A) Overview of the behavioral protocol. Each day, animals were exposed to a resting environment (a familiar non-anxiogenic flowerpot) and to two testing environments (A,B). In habituation sessions (2 days, left), animals were exposed to context A and context B and to the auditory stimuli employed in the protocol. This was followed by fear conditioning (2 days, middle) where the presentations of the conditioned stimulus (CS+) in context A were coupled with the delivery of aversive footshocks. In the following days of the protocol (6–12 days, right), the animals underwent contextual fear extinction in context A as well as cued fear extinction in context B (see Section 4). (B) Example neural activity recorded during sleep in the resting environment (left, see Supplementary Video 1) and during freezing in context A (right, Supplementary Video 2) in the first day of extinction training. Time stamps corresponding to those overlaid in Supplementary Video frames are shown on top. (Top) Animal speed as measured by head movements; red dotted line: threshold used to detect immobility; gray shadings: immobility periods. (Middle) Spectrograms of the LFP recorded in the medial prefrontal cortex (mPFC) and hippocampus (HPC). Vertical dashed lines: The boundaries of example intervals represented on the bottom. (Bottom) mPFC and HPC LFP signal recorded in the intervals marked above. Blue: raw recorded LFP; red: filtered LFP in the delta, 4 Hz, theta, and spindle frequency bands; black: instantaneous amplitude of the filtered LFPs.

