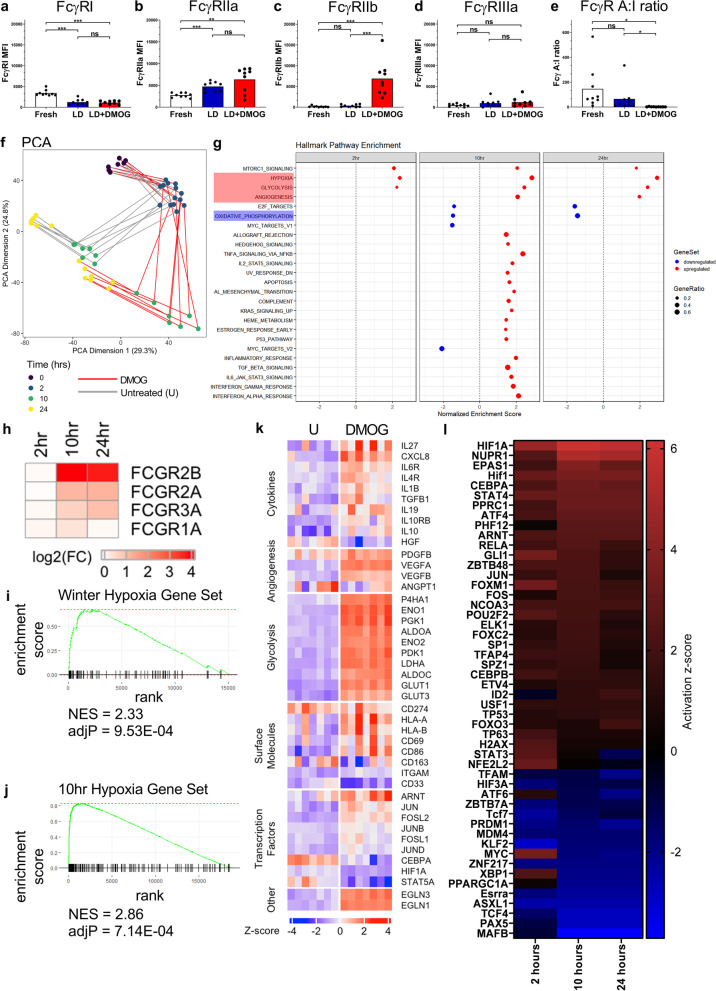
Fig. 3.
Transcriptional profiling and immunophenotyping of human monocytes during HIF-prolyl hydroxylase inhibition. a-e, FcγR expression levels and FcγR A:I (FcγR activating:inhibitory) ratio were quantified using flow cytometry (n = 7). Statistical significance between groups was assessed using a paired two-tailed Wilcoxon test (*p < 0.05, **p < 0.01 and ***p < 0.001). f-l, RNA-Seq analysis of the transcriptome of untreated and DMOG treated monocytes cultured for 0 (fresh), 2, 10, and 24 h. f, Monocyte gene expression time course trajectories in principal component space (dimensions 1 and 2). Principal Component Analysis (PCA) on 6198 differentially expressed genes for untreated versus DMOG-treated comparisons. g, Pre-ranked GSEA; genes were ranked according to their differential expression between monocytes at 10 h post-DMOG treatment and fresh monocytes. Twenty-five Hallmark gene sets (v7.2) were significantly overrepresented (FDR < 0.05), with gene sets of interest highlighted red, indicating upregulated gene expression across all time-points, and the oxidative phosphorylation gene set highlighted blue, showing downregulation of gene expression. h Expression fold changes (log2(FC)) for FCGR genes between untreated and DMOG-treated monocytes. i, Enrichment plot of Winter hypoxia gene set in monocytes at 10 h post-DMOG treatment vs fresh monocytes (NES = 2.33). j, Enrichment plot of the Hallmark hypoxia gene set in DMOG treated monocytes at 10 h vs fresh monocytes (NES = 2.86). k, Gene expression heat map for differentially expressed genes of interest in untreated (U) and DMOG-treated monocytes at 10 h post-culture. Columns represent monocyte samples from 7 donors. l, Upstream regulator analysis was performed using IPA. Heat map of activation z-scores indicates the top 50 transcription factor genes and proteins predicted to be activating or inhibiting when comparing untreated monocytes with DMOG treated monocytes (n = 7 per group). Also see Additional file 3: Fig. S3

