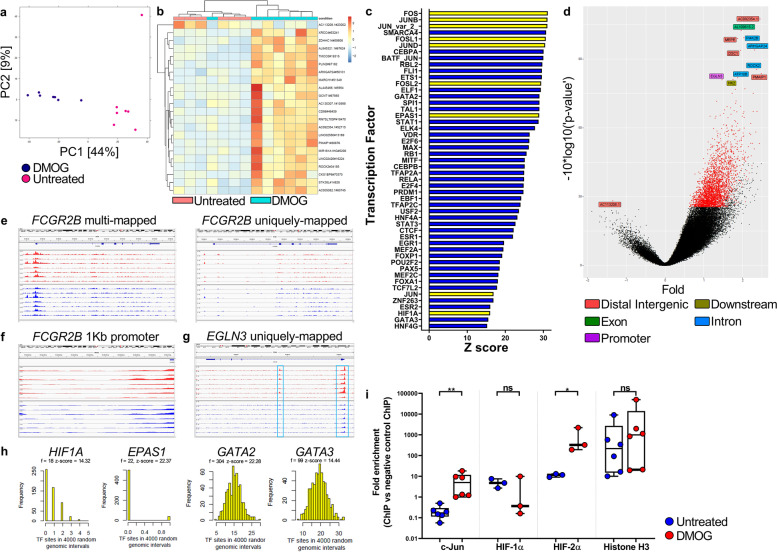
Fig. 4.
Characterisation of gene openness and transcriptional regulation of FCGR2B gene in response to DMOG treatment. a, DNA from untreated and DMOG treated monocytes 24 h post-treatment was assessed to determine chromatin accessibility. PCA of gene accessibility in differentially open genes for untreated versus DMOG-treated samples, 24 h post-treatment. b, Hierarchical cluster analysis heat map of sample dissimilarity based on significantly opened or closed regions (n = 7 per group). c, Transcription factor DNA binding motifs identified in significantly opened regions in DMOG treated versus untreated samples. HIFs and AP-1 proteins are colored yellow. d, Volcano plot showing genes significantly opened or closed in DMOG-treated monocytes when compared to untreated donor matched monocytes. e, Gene coverage tracks of FCGR2B at the 10-h time point post-treatment. Gene tracks represent unique donors. DMOG-treated monocyte samples are coloured red and donor matched untreated samples are coloured blue (n = 7 per group). f, Gene coverage tracks of the 1 Kb region upstream of FCGR2B TSS for ATAC-seq alignments, 10 h post-treatment. g, Gene coverage track for the EGLN3 gene, 10 h post-treatment. h, Frequency (f) of TF binding sites in differentially open peaks between DMOG treated and untreated monocytes. Z-scores for this observed frequency in relation to the frequency distribution of TF binding occurrences in 4000 random genomic intervals, repeated 1000 times. Frequency distributions for the number of HIF-1α, HIF-2α, GATA2 and GATA3 binding sites are shown. Frequency (f) of TF binding sites. i, Box and whisker chart showing ChIP–quantitative PCR confirmation of TF binding to the 1 Kb region upstream of the FCGR2B TSS in the promotor region. Plots show all mAb binding and subsequent PCR amplification of the FCGR2B gene promotor region normalized to the signal achieved in the donor matched isotype control mAb ‘ChIPed’ DNA samples (n = 3–6 per group). Statistical significance was assessed using a paired two-tailed Wilcoxon test (*p < 0.05, **p < 0.01 and ns = non-significant). Also see Additional file 4: Fig. S4

