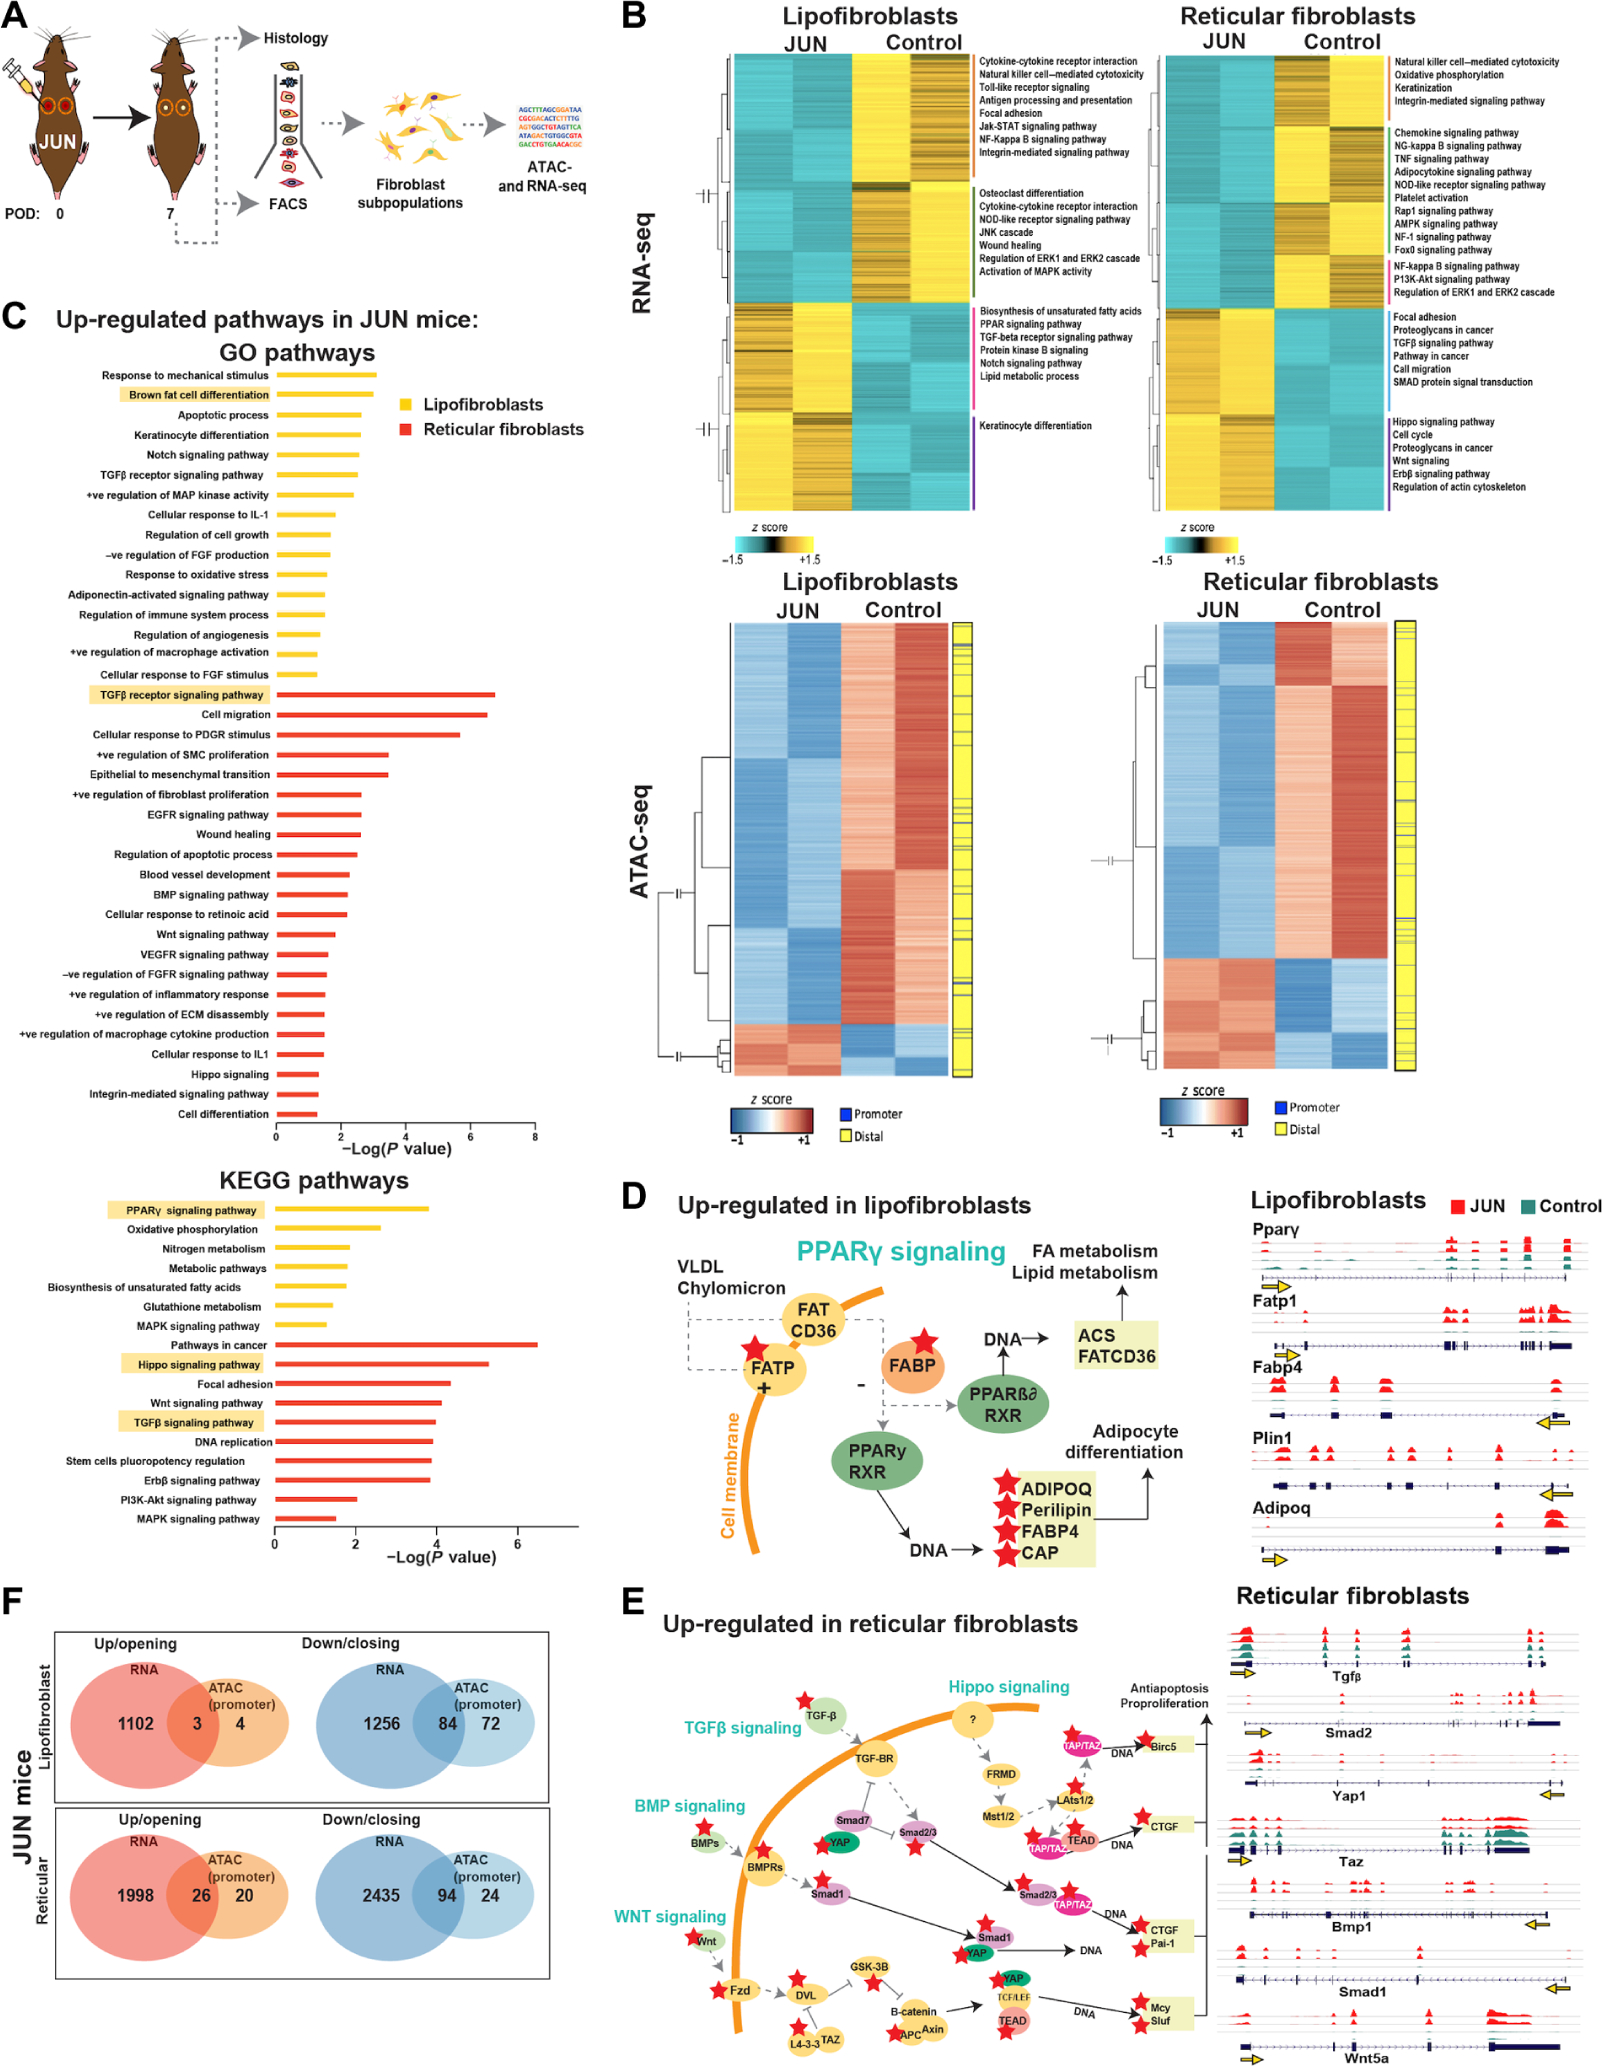
Fig. 3. Jun up-regulates fibrotic signaling pathways in reticular fibroblasts and PPARγ signaling in lipofibroblasts.

(A) Schematic showing experimental approach: Lipofibroblast and reticular fibroblasts were isolated by FACS on POD 7 for ATAC- and RNA-seq analysis. (B) Heatmap showing hierarchical clustering of differentially expressed genes (FDR < 0.01, fold change > 2) between JUN and Control in lipofibroblasts (top left) and reticular fibroblasts (top right). Heatmap showing chromatin regions with changes in accessibility (FDR < 0.01, fold change > 2) in JUN versus Control mice in lipofibroblasts (bottom left) and reticular fibroblasts (bottom right). (C) Gene set enrichment analysis showing the most up-regulated GO (top) and Kyoto Encyclopedia of Genes and Genomes (bottom) pathways (based on RNA-seq data) in JUN versus Control mice in lipofibroblasts (yellow) and reticular fibroblasts (red) on POD 7. (D) Schematic showing the up-regulated genes identified from the PPARγ signaling pathway in lipofibroblasts in JUN versus Control mice on POD 7; red stars show significantly up-regulated genes (P < 0.05). Gene expression track analysis of individual genes in the PPARγ signaling pathway up-regulated in lipofibroblasts in JUN versus Control mice on POD 7. Yellow arrow indicates the promoter. (E) Schematic showing significantly up-regulated genes identified from multiple converging fibrotic signaling pathways [Hippo, transforming growth factor–β (TGFβ), bone morphogenic protein (BMP), and wingless (WNT)] in reticular fibroblasts in JUN versus Control mice on POD 7; red stars show significantly up-regulated genes (P < 0.05). Gene expression track analysis of individual genes found in the fibrotic signaling pathways up-regulated in reticular fibroblasts in JUN versus Control mice on POD 7. Yellow arrow indicates the promoter. (F) Genes with significantly increased expression and opening promoter chromatin (distance from TSS <100 kb) (left, red) or decreased expression and closing promoter chromatin (right, blue) in lipofibroblasts (top) and reticular fibroblasts (bottom) in JUN versus Control mice on POD 7 (P < 0.05). Significant genes found to be both up-regulated and with opening chromatin in JUN versus Control mice in reticular (bottom, n = 26) and lipofibroblasts (top, n = 3) (*P < 0.05). All data are presented as means ± SEM.
