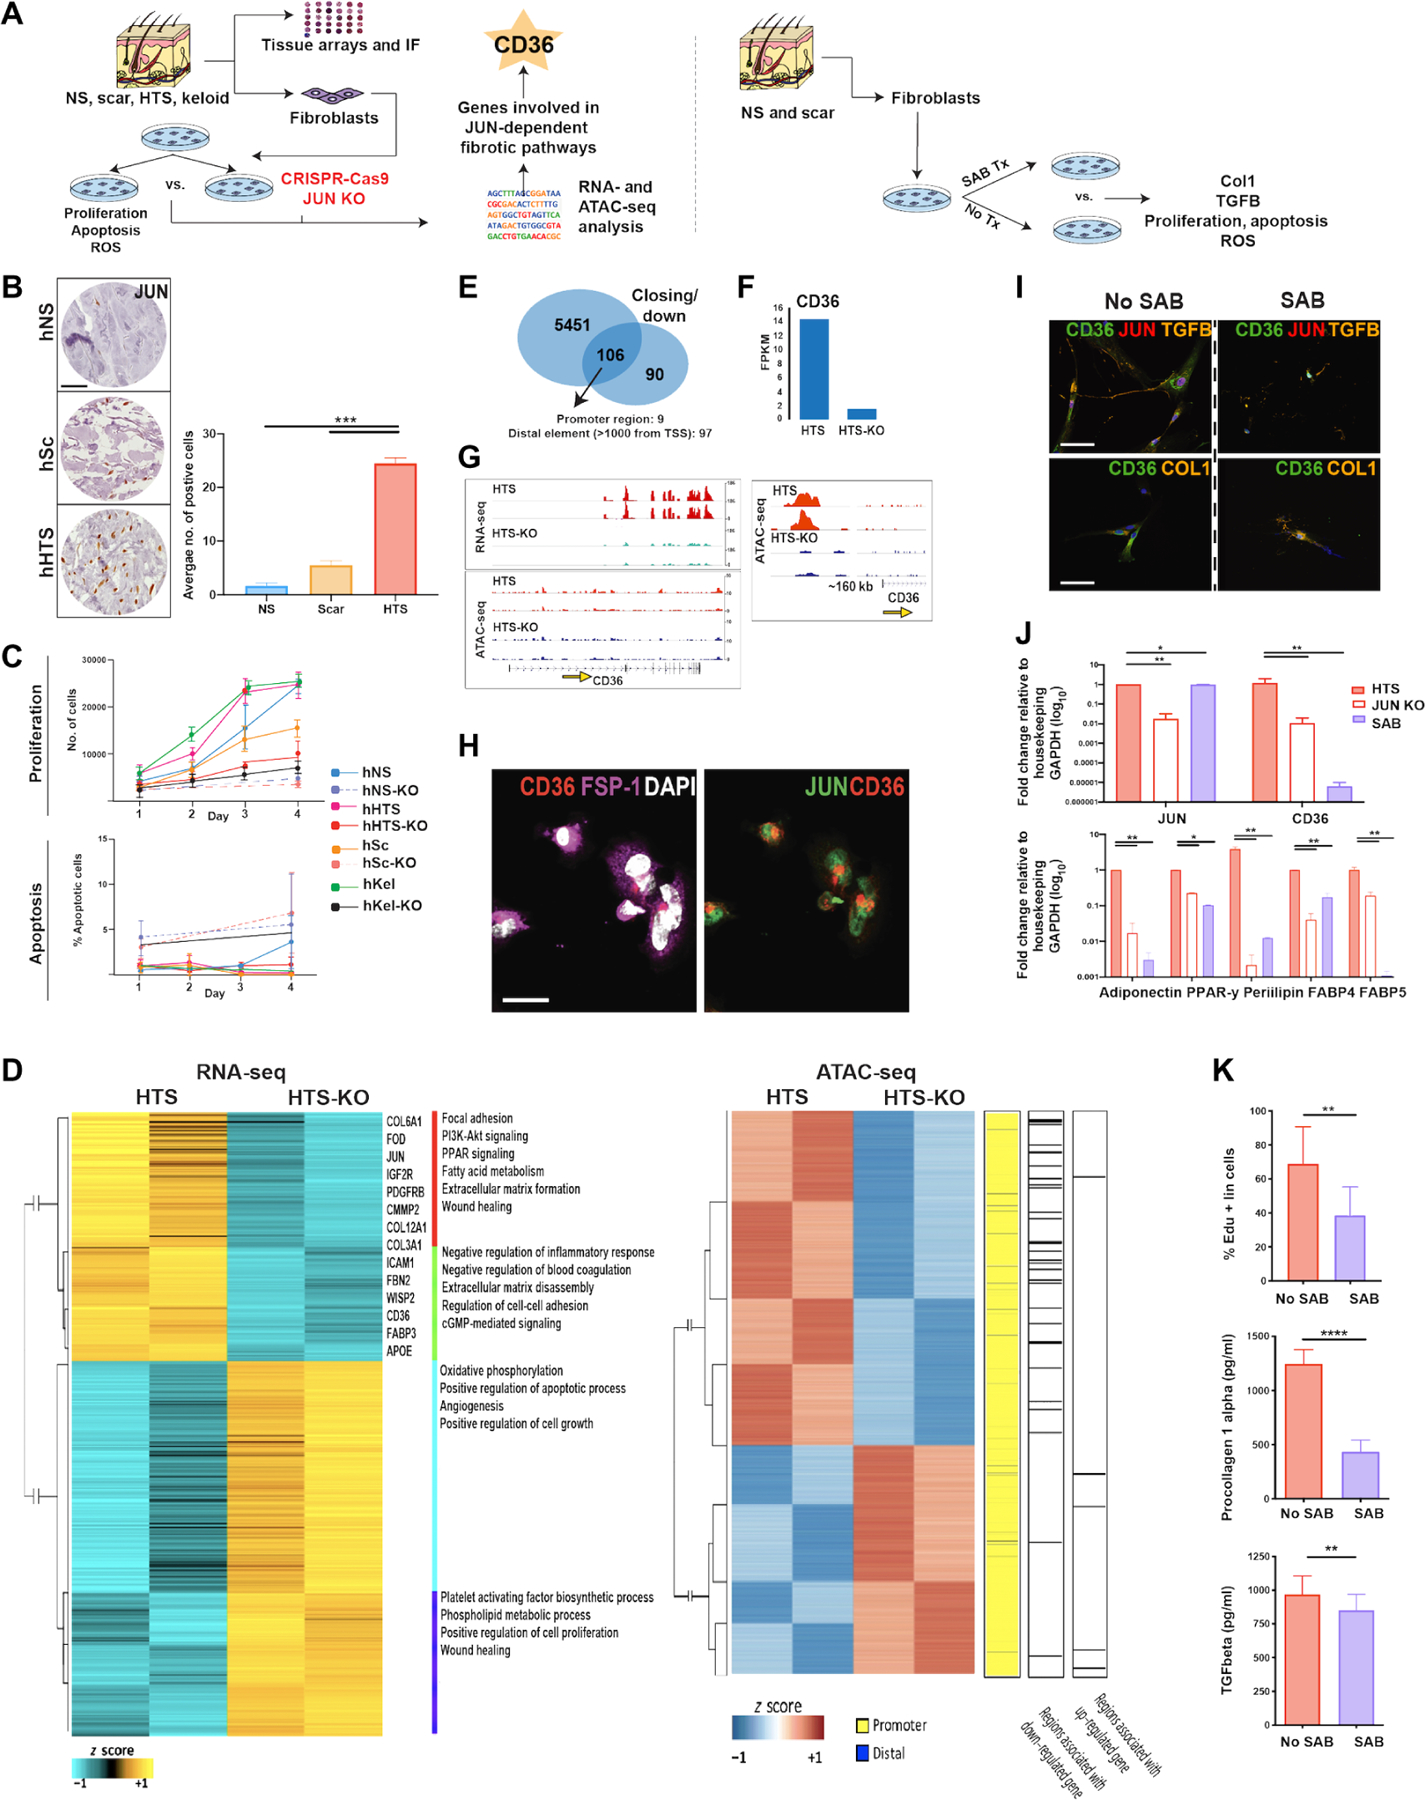
Fig. 4. CD36 antagonism minimizes JUN-dependent fibroproliferative activity.

(A) Schematic of experimental approach. Left: Human normal skin (NS), scar, HTS, and keloid specimens were assessed for expression of JUN and fibrogenic fibroblast markers using tissue protein arrays and immunofluorescence (IF). Primary cultures of fibroblasts were derived from skin specimens, and CRISPR-Cas9 was used to delete JUN expression. Human fibroblasts derived from HTSs (hHTSs) with (KO) and without (non-KO) JUN deletion were compared for proliferation, apoptosis, and by RNA- and ATAC-seq. Right: hHTS-derived human fibroblasts were treated with salvianolic acid (SAB; 100 μM) for 48 hours before analysis of COL1 and TGFβ protein secretion, proliferation, apoptosis, and production of reactive oxygen species (ROS). (B) Tissue array showing JUN expression in hNS, non-keloid scar (hSc), and hHTS. Scale bar, 10 μm. (C) Apoptosis and proliferation analysis of HTS fibroblasts with and without KO of JUN over 4 days, assessed using annexin V and 5-Ethynyl-2′-deoxyuridine (EdU) labeling, respectively. (D) Heatmaps from RNA- and ATAC-seq comparative analysis showing differently expressed genes (FDR < 0.01, fold change > 2) and chromatin accessibility regions in HTS and HTS-KO fibroblasts. (E) Bar chart demonstrating the genes that were significantly down-regulated (90), exhibited a decrease in chromatin accessibility (5451), and exhibited both a decrease in chromatin accessibility and were down-regulated (106) in KO versus non-KO HTS fibroblasts (P < 0.05). (F) Bar graph showing the FPKM (fragments per kilobase of exon model per million reads mapped) of CD36 in HTS versus HTS-KO fibroblasts. (G) RNA-seq expression and ATAC-seq tracks for CD36 in HTS fibroblasts. Yellow arrow indicates the promoter. (H) Plated hHTS fibroblasts immunostained with (left) fibroblast-specific protein 1 (FSP-1, purple)/CD36 (red)/DAPI (white) and (right) JUN (green)/CD36 (red). Scale bar, 10 μm. (I) Plated hHTS fibroblasts immunostained with CD36 (green)/JUN (red)/TGF-β (orange, top row) and CD36 (green)/COL1 (orange, bottom row) without (left) and with (right) SAB treatment. Scale bars, 10 μm. (J) RT-qPCR analysis (top); JUN and CD36 expression in hHTS fibroblasts at baseline, after SAB treatment, and in hHTS-KO fibroblasts. Bottom: Adipogenic-associated genes [Adipoq (adiponectin), peroxisome proliferator–activated receptor-γ (Ppar-γ), Perilipin, Fatty acid–binding protein 4 (Fabp4), and Fabp5] in hHTS fibroblasts at baseline, after SAB treatment, and in hHTS-KO fibroblasts (*P < 0.05 and **P < 0.01). (K) hHTS fibroblasts with and without 48 hours of SAB treatment compared for proliferation by EdU staining (top), COL1 secretion (middle), and TGFβ (bottom) secretion. All data are presented as means ± SEM. n = 3 independent experiments. *P < 0.05, **P < 0.01, ***P < 0.001, and ****P < 0.0001.
